
76 Interpretation
paced rhythm. atrial and biventricular. Undersensing.

77 Interpretation
Atrial Sensed, Ventricular Paced

78 Interpretation
A sensed, V paced. LBBB morphology

79 Interpretation
A paced, biventricular Paced


80 Interpretation
occasioanlly atrial paced. Of note, the morphology of the QRS looks the same in the paced and unapced beats. That’s because since the atrium is being paced, the impulse to ventricles still travels through the AV node and into the HIS bundle, etc

81 Interpretation
RBBB with LAD = bifascular block. RBBB should have normal axis. LAD in the setting of a RBBB is suggestive of a posterior hemiblock. Those together are a bifasciular block.

82 Interpretation
Atrial Flutter with 2:1 block
83 Interpretation
sinus tachycardia, LAD, meets voltage criteria for LVH
84 Interpretation
Atrial Paced Rhythm, normal axis, no ST elevation/depression

85 Interpretation
Looks like it is supposed to be an atrial paced rhythm, with a very long PR interval. But there are not clear P waves after the spike and the spike falls at strange places, especially towards the end of the strip. This is suspicious for a some sort of device failure.

86 Interpretation
RBBB
87 Interpretation
a sensed, V paced. Most of the leads look like a LBBB, although the QRS is downgoing in V5 and V6, which is not typical of a LBBB. The QRS is upright in the ‘other’ lateral leads: I, and aVL, which is c/w LBBB. I can’t think of reason that the QRS could be negative in V5 and V6 but positive in I and aVL other than poor lead positioning.
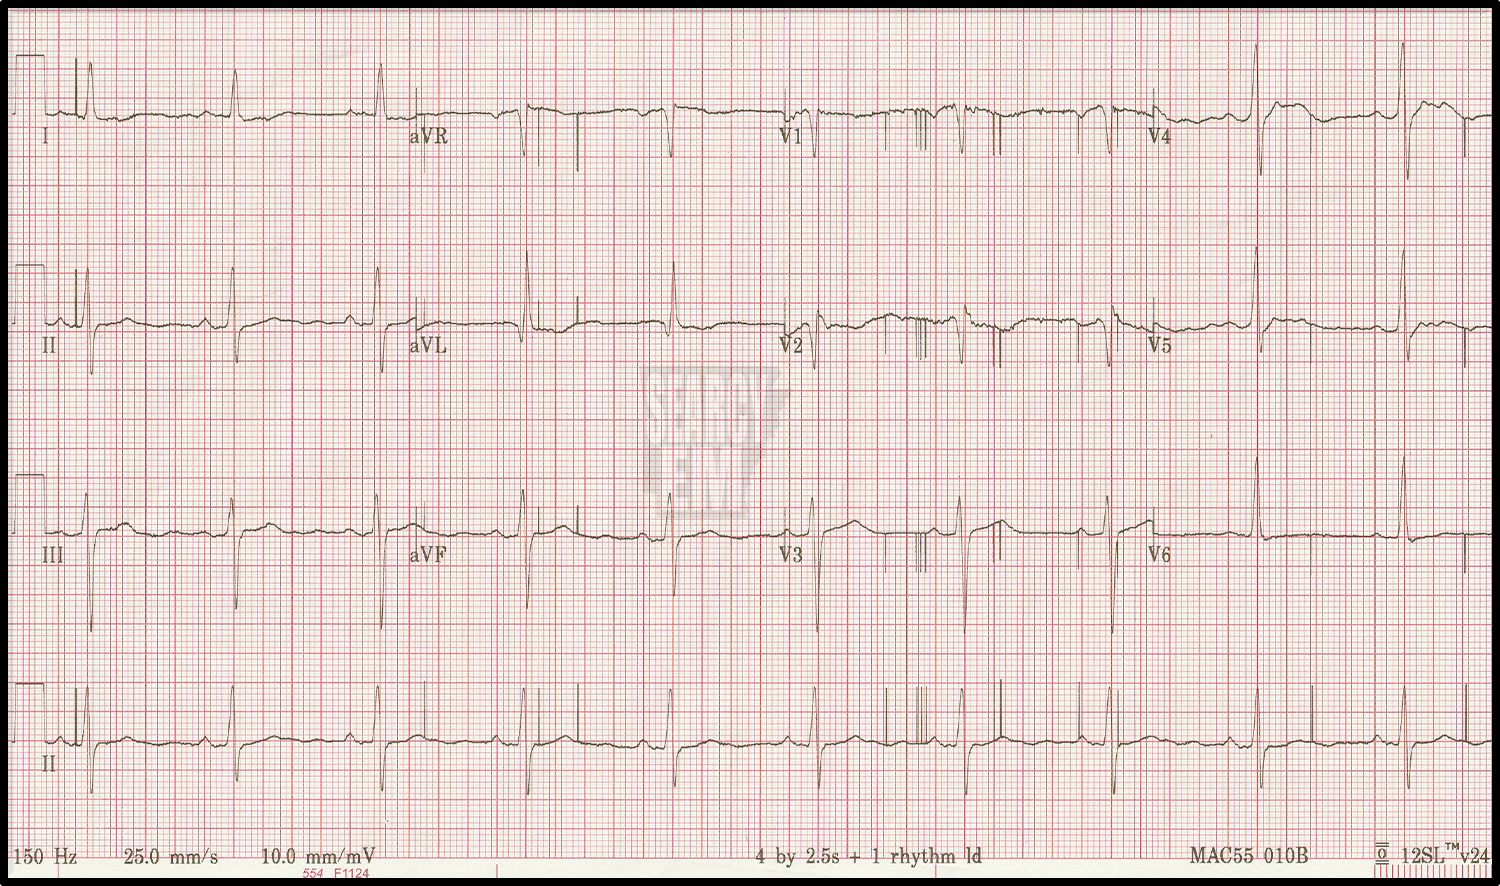
88 Interpretation
This is an atrial paced rhythm. Interestingly, no every spike is captured. Look specifically at aVL. There is a gap between the spike and the P wave. That is probably a non captured spike, because the P wave should come immediatley after the spike. If you look at the last 2 beats on the strip (lead II) you see that there ARE P waves IMMEDIATELY after the pacer spike. Those certainly look like they were captured and have Primary AV block (which is common in atrial paced rhythms). Otherwise, this is a normal EKG.

89 Interpretation
Normal Sinus rhythm with RBBB. normal axis, as is typical in RBBB.

91 Interpretation
Sinus tachycardia (probably? I think I see V2). LBBB, normal Axis. (remember that LAD, is COMMON in LBBB, but is not part of the diagnostic criteria.
93 Interpretation
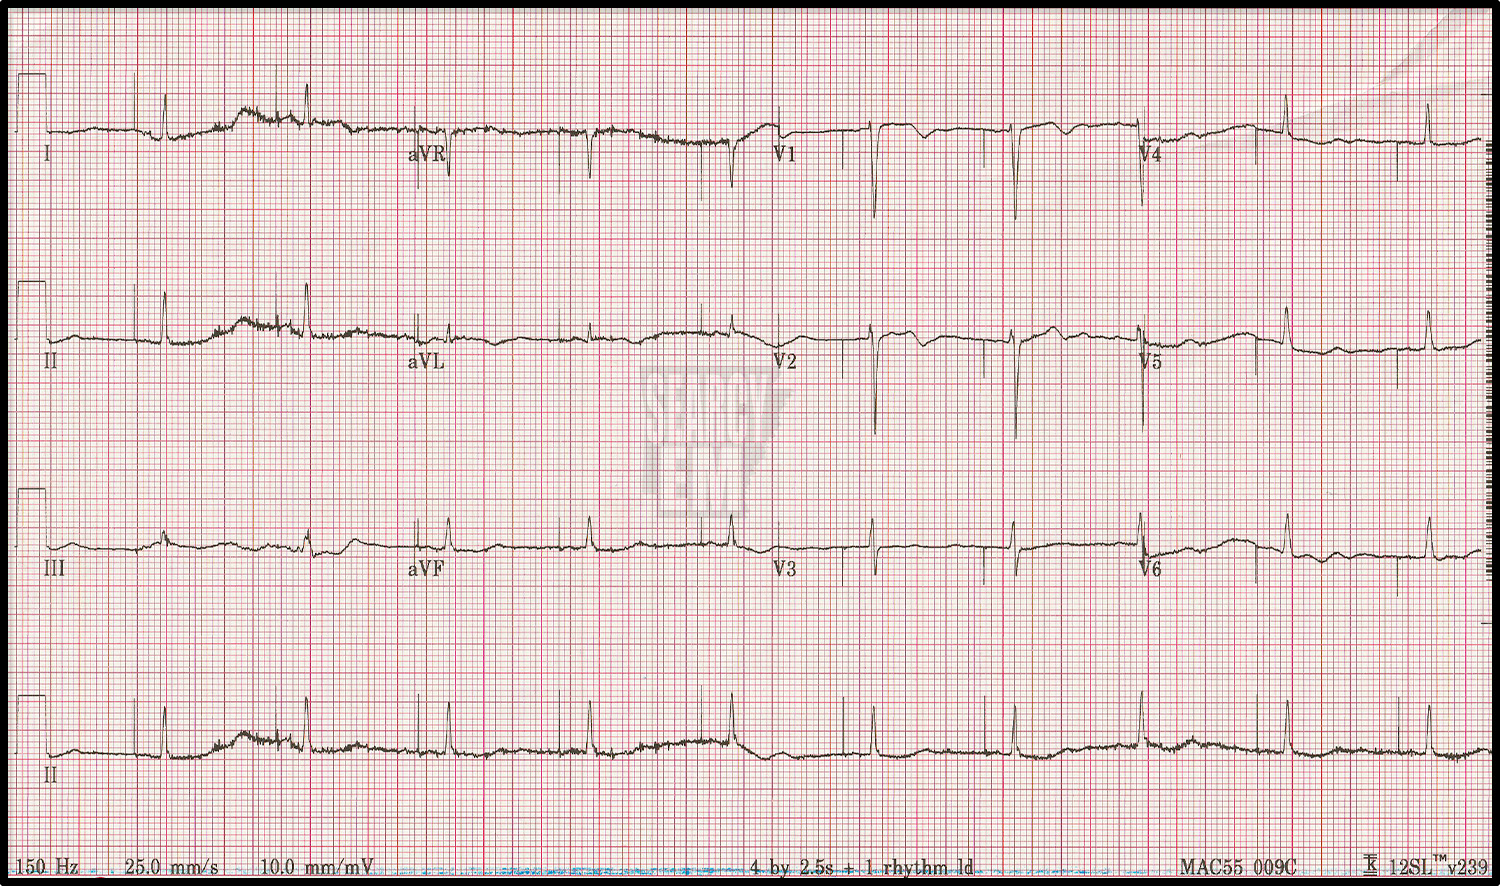
Normal Sinus rhythm. The finding here is the pacemaker spikes that are seemingly falling at random times and not leading to depolarizations. This is pacemaker “failure”. There are several types of failure, and if you to pick one on the test, the answer is probably “under-sensing”. Under sensing means the pacemaker is not accurately detecting the underlying rhythm appropriately and therefore sending electrical stimuli at inappropriate times. In this case, we also are seeing failure to capture. This is probalby not an “emergency”, as the underlying rhythm is fine (at the moment), but this may need setting adjusted or there may be issues with lead positioning/migration.

94 Interpretation
This one looks strange. It is normal sinus. The QRS is downgoing in leads I and aVL, and up in aVR. When you see that, you often think of limb lead reversal. However, in this case the QRS is also up in V1. V1 and aVR almost always go in the same direction, so it may be real. This may just be a Right Axis Deviation. Also note that V2 is very positive. It is unusual for V2 to be so positive, and the contiguous lead (V3) to be so negative. I wonder if there is an issue wtih lead positioning, whether or not they are actually switched. On the other hand, it may just be RAD, for one the standard causes of RAD (RVH, PE, etc).

95 Interpretation
atrial sensed, ventriuclar paced. LBBB morphology

96 Interpretation
normal sinus. There are three interesting findings here. First is the notched or biphasic P waves noticeable in several leads, specifically in lead II. Remember that the P wave is atrial depolarization and that the right atrium depolarizes first. There are technically 2 phases to a normal P wave, but the happen so close together temporally that we only see one wave on the tracing. However if one the atria are pathologic, we might see a different pattern. If the Right atrium is hypertrophic, the first wave of the P wave gets really big and obscures/includes the second (left) phase. We call the P pulmonale. On the other hand, if the left atrium is hypertrophic, the second part of the P wave, which is usually obscured by the first part, becomes distinct and this is most noticeable in lead II – P mitrale. I suspect that is what we are seeing here. So, I’d bet this person has some underlying pathology on the left sided (mitral valve disease, LVH, etc) that is causing left atrial hypertrophy. The second finding are the biphasic T waves seen in V2, V4, and V5. When you seen biphasic T waves in the anterior leads, you should consider Wellen syndrome. In this case, chart review showed that these had been seen on prior EKGs. However, the point remains that biphasic T waves should prompt consideration of Wellens Syndrome. The third finding is the fact that the biphasic T waves seem to skip lead V3. How can that be? I suspect the leads were placed sloppily, such that lead V3 was actually to the anatomic right of V2. (I’ve done a blog post on this issue.)
follow up: this images was chosen for includsion based on the biphasic t waves. However, clinically, this patiet had these chronically. In other words, it didn’t look like an acute/subacute finding as would be expected to be the case in a Wellens syndrome. As I look back, I wonder now if I’m seeing an epsilon wave in lead V1 and V3. I hate to muddy the water, but it’s an interesting case. Perhaps this person needed a cardiac MRI? Here is a link to more information about epsilon waves and Arrhythmogenic Right Ventricular Dysplasia.

Look into for yourself it you have time.
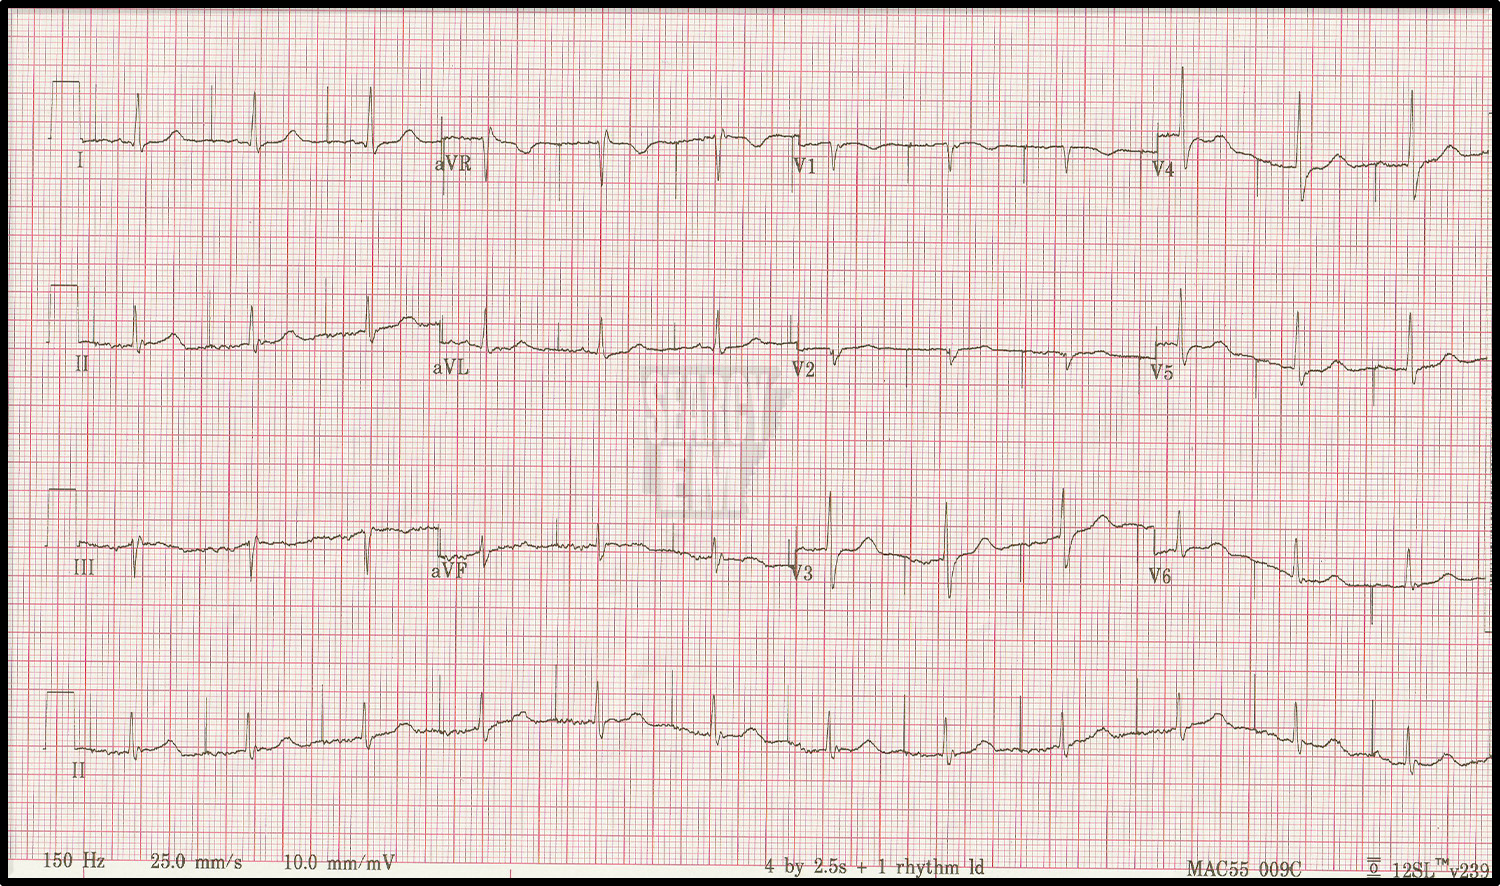
97 Interpretation
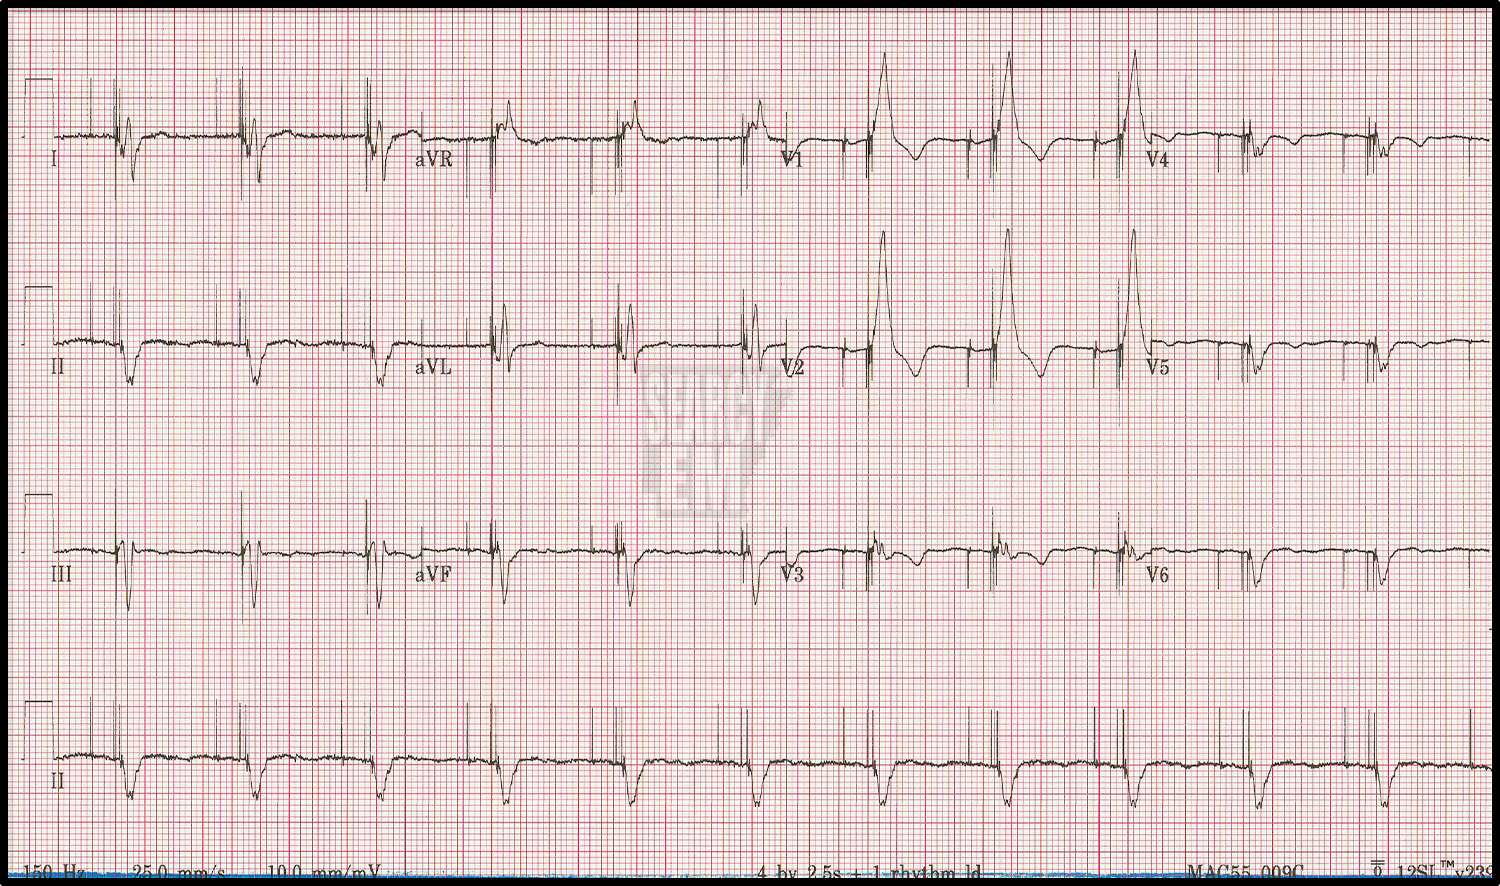
AV sequential pacemaker, biventricular leads. Interestingly, there is a RBBB pattern here rather than LBBB, which is what we typically see with ventricular paced rhythms.
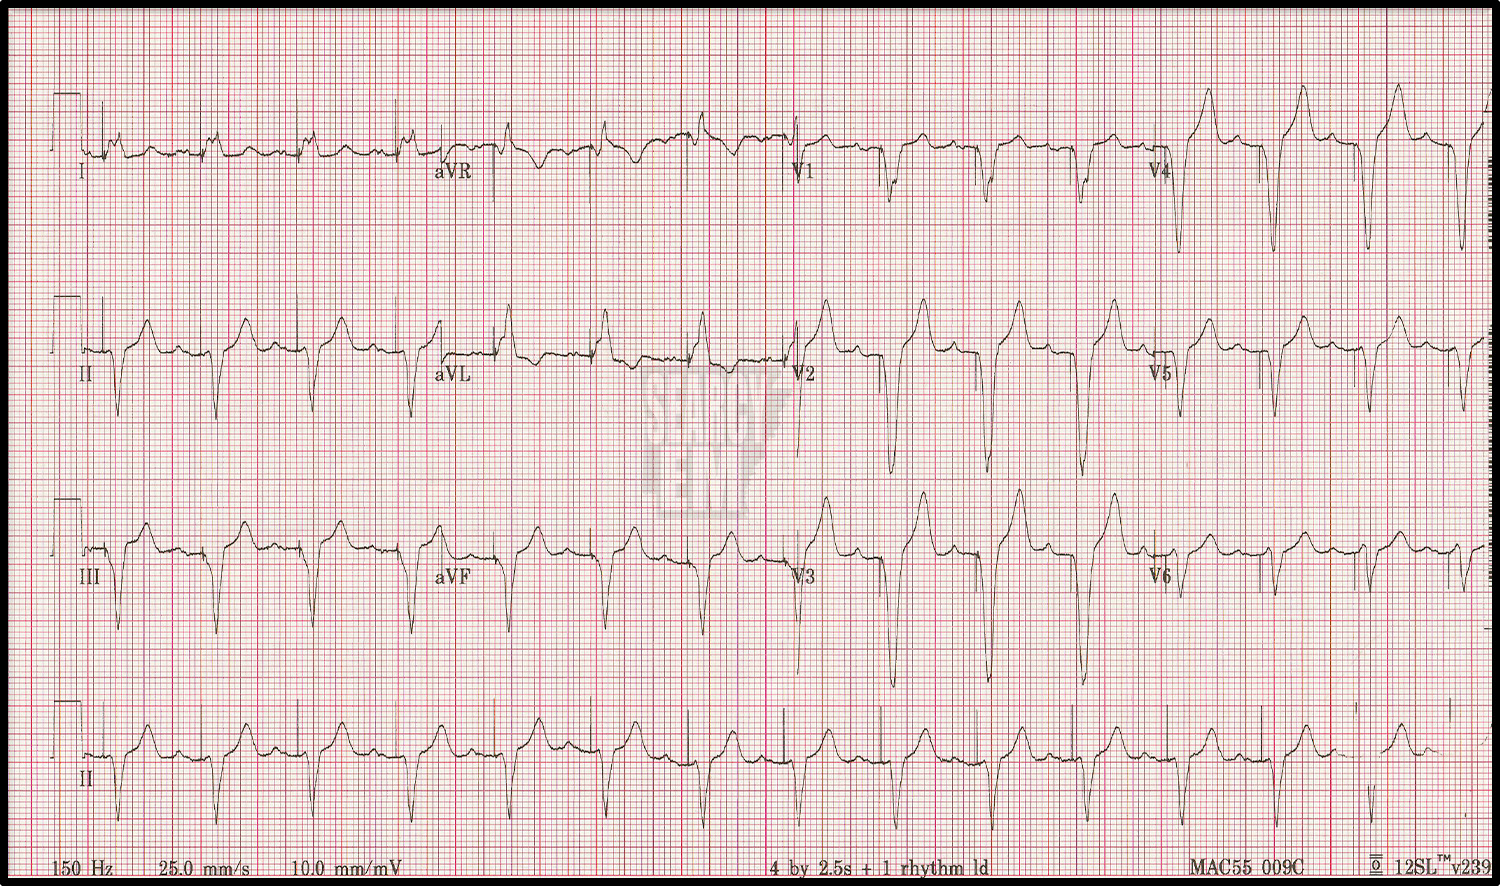
98 Interpretation
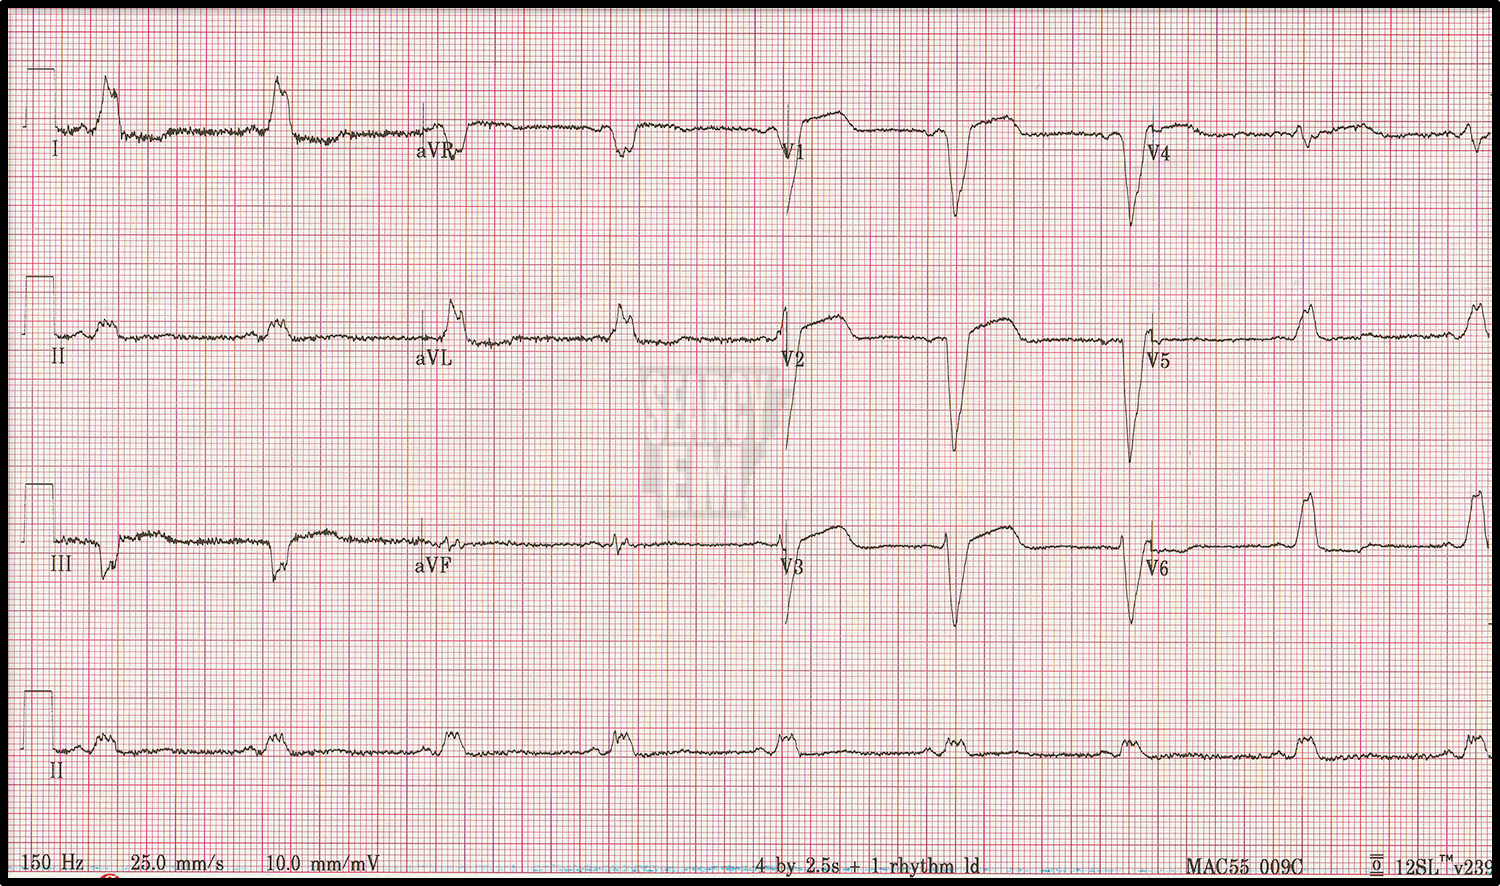
Normal sinus with LBBB
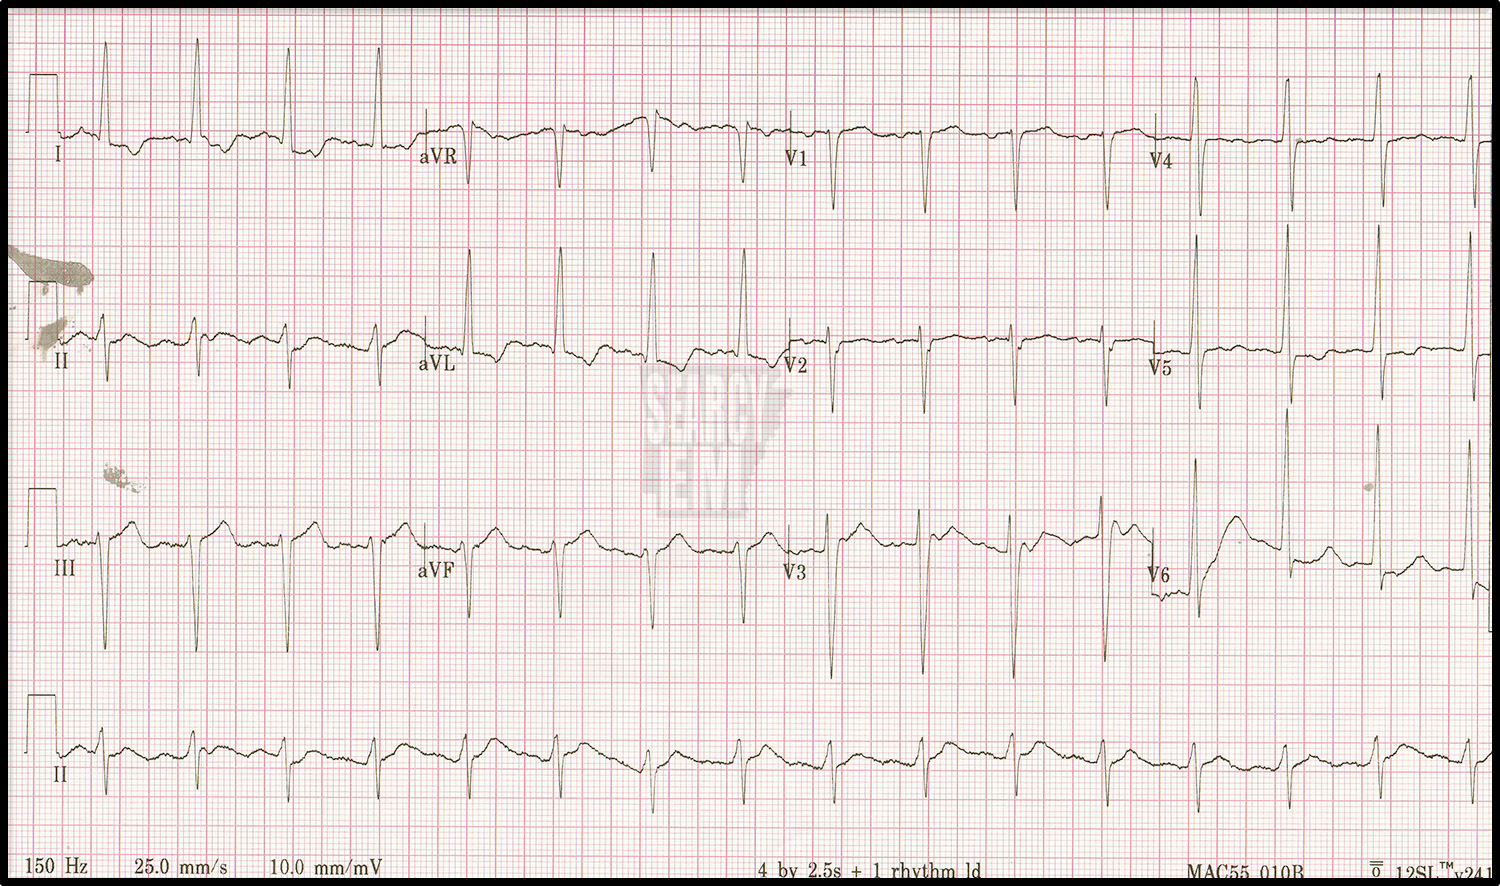
99 Interpretation
Atrial paced rhythm. Normal axis. normal QRS duration. No ST segment elevation nor depression

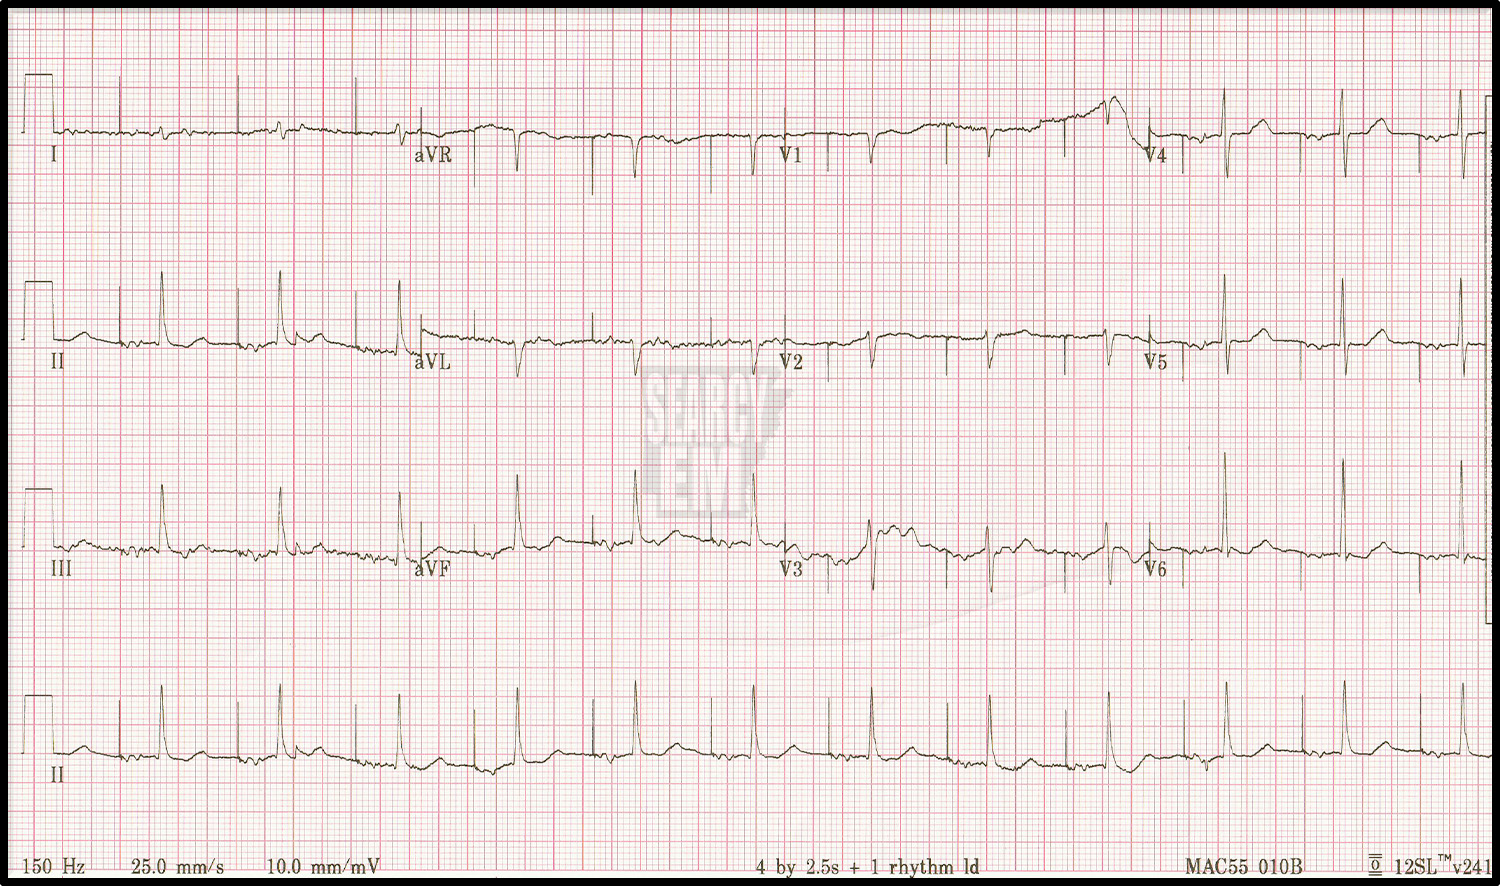
100 Interpretation
Atrial paced rhythm. No ischemic changes. Normal QRS duration.
