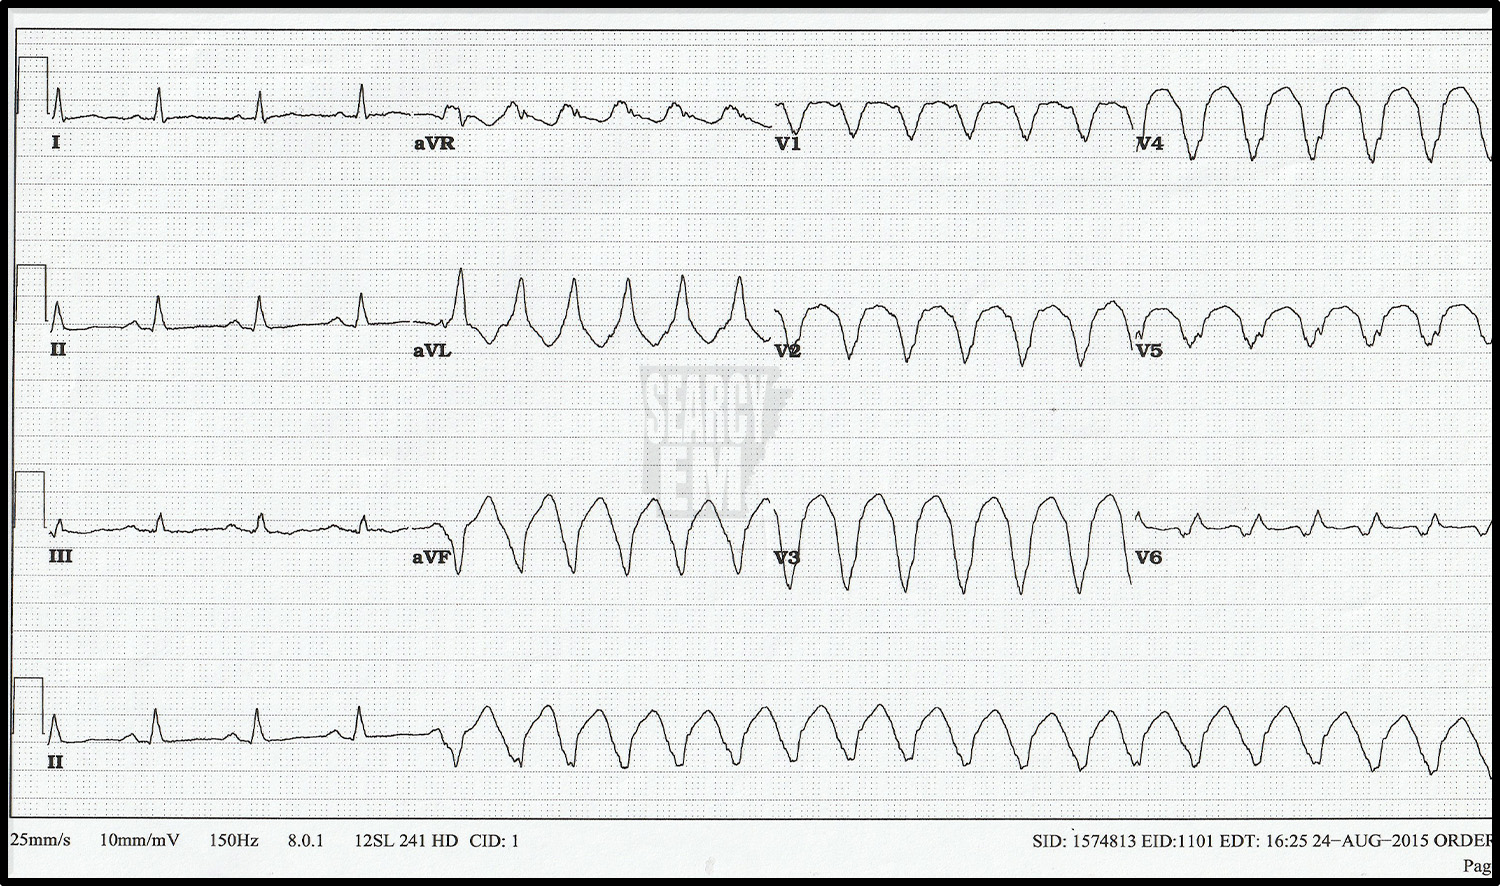
70 Interpretation
VT
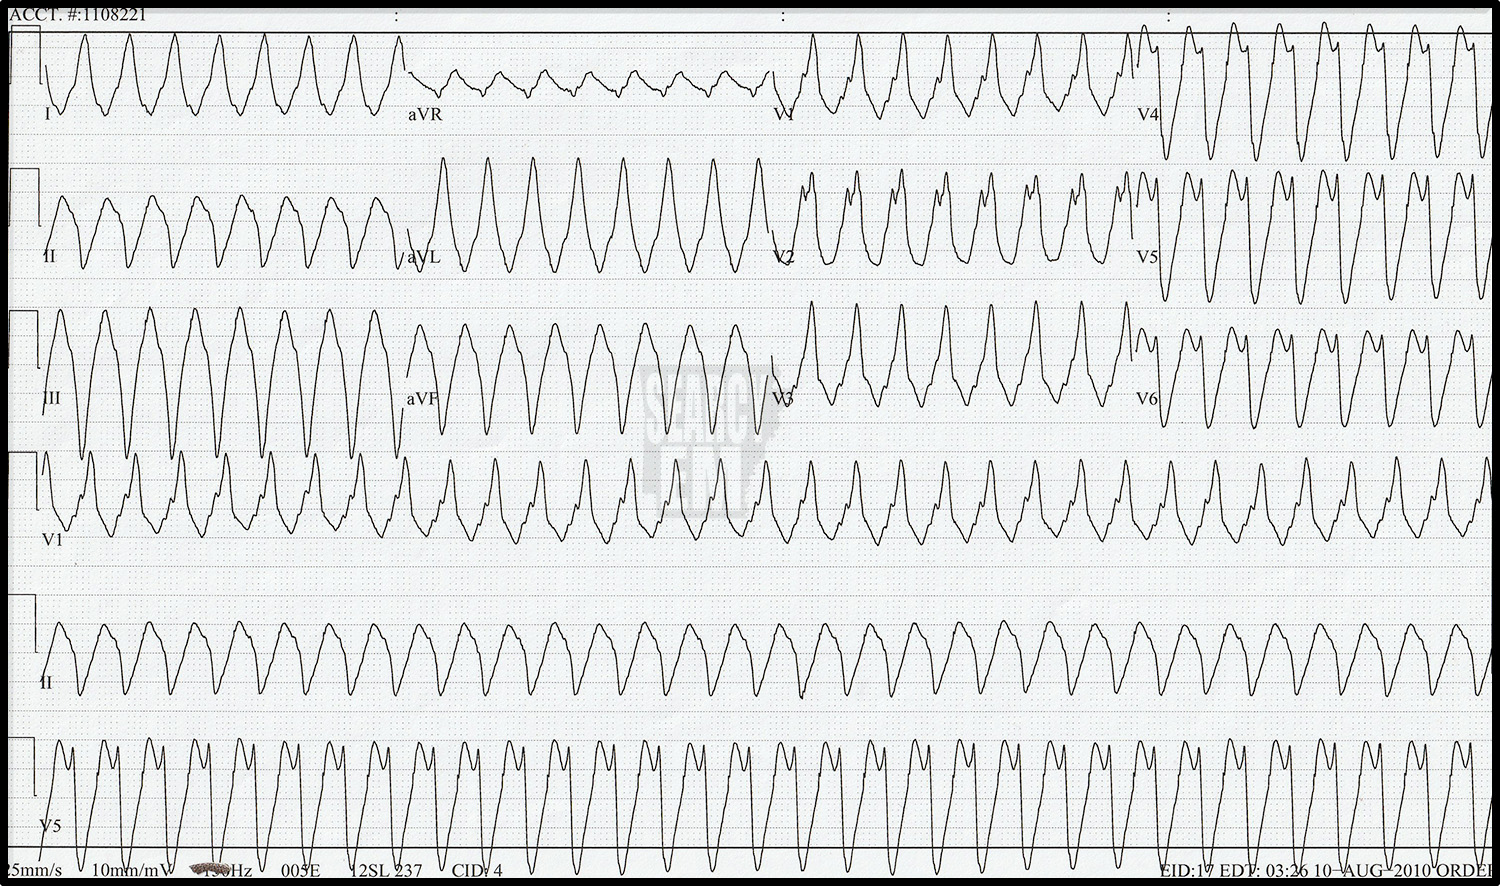
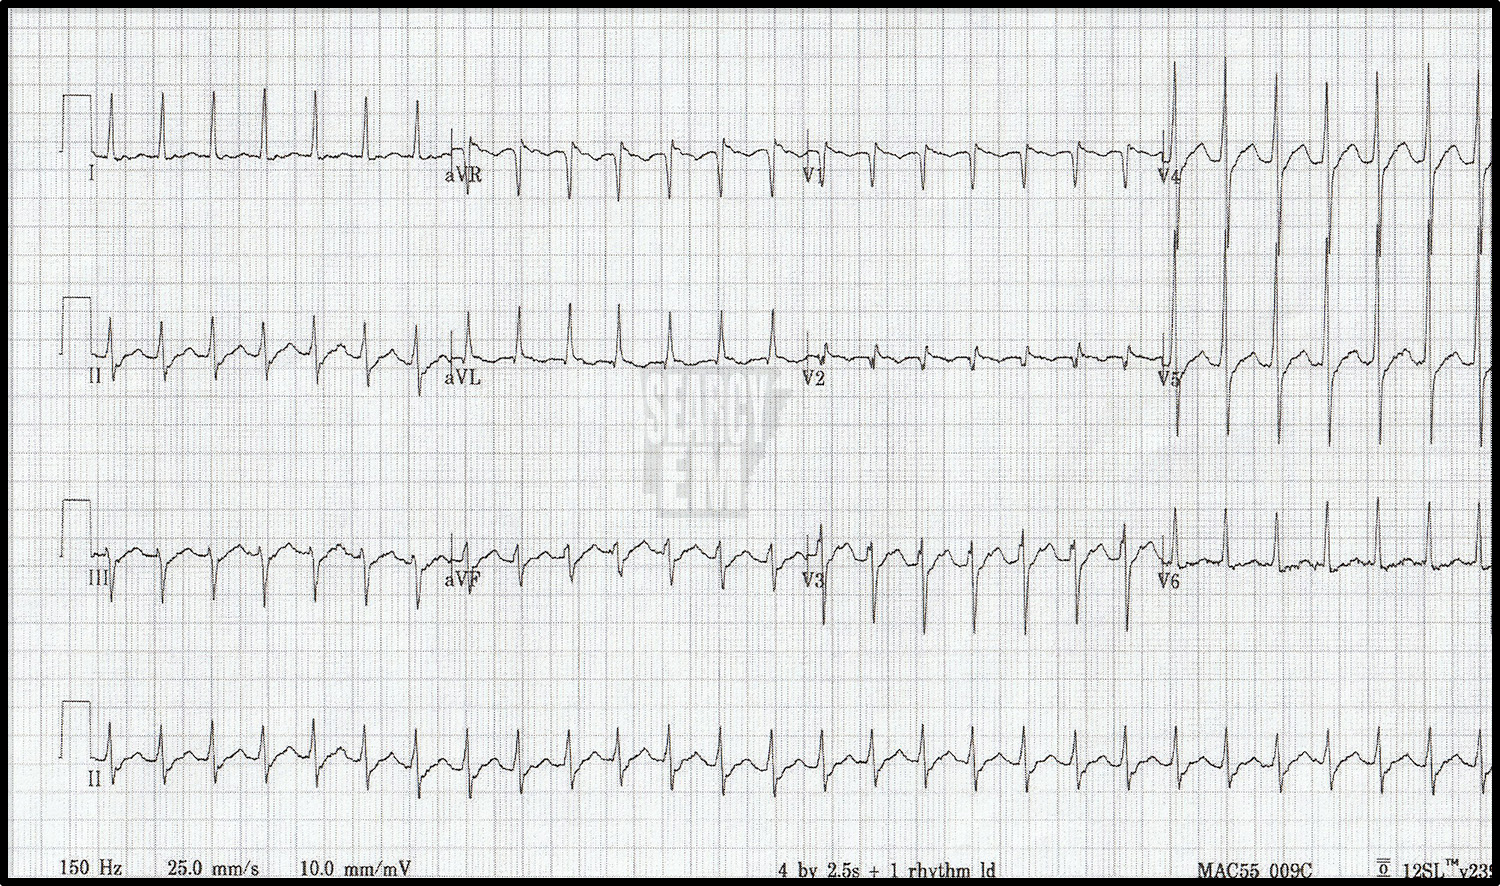
71 Interpretation
VT. The EKG happens to catch the initiation of the VT as you can see on the rhythm strip at the bottom of the page.

27 Interpretation
Third degree AV block

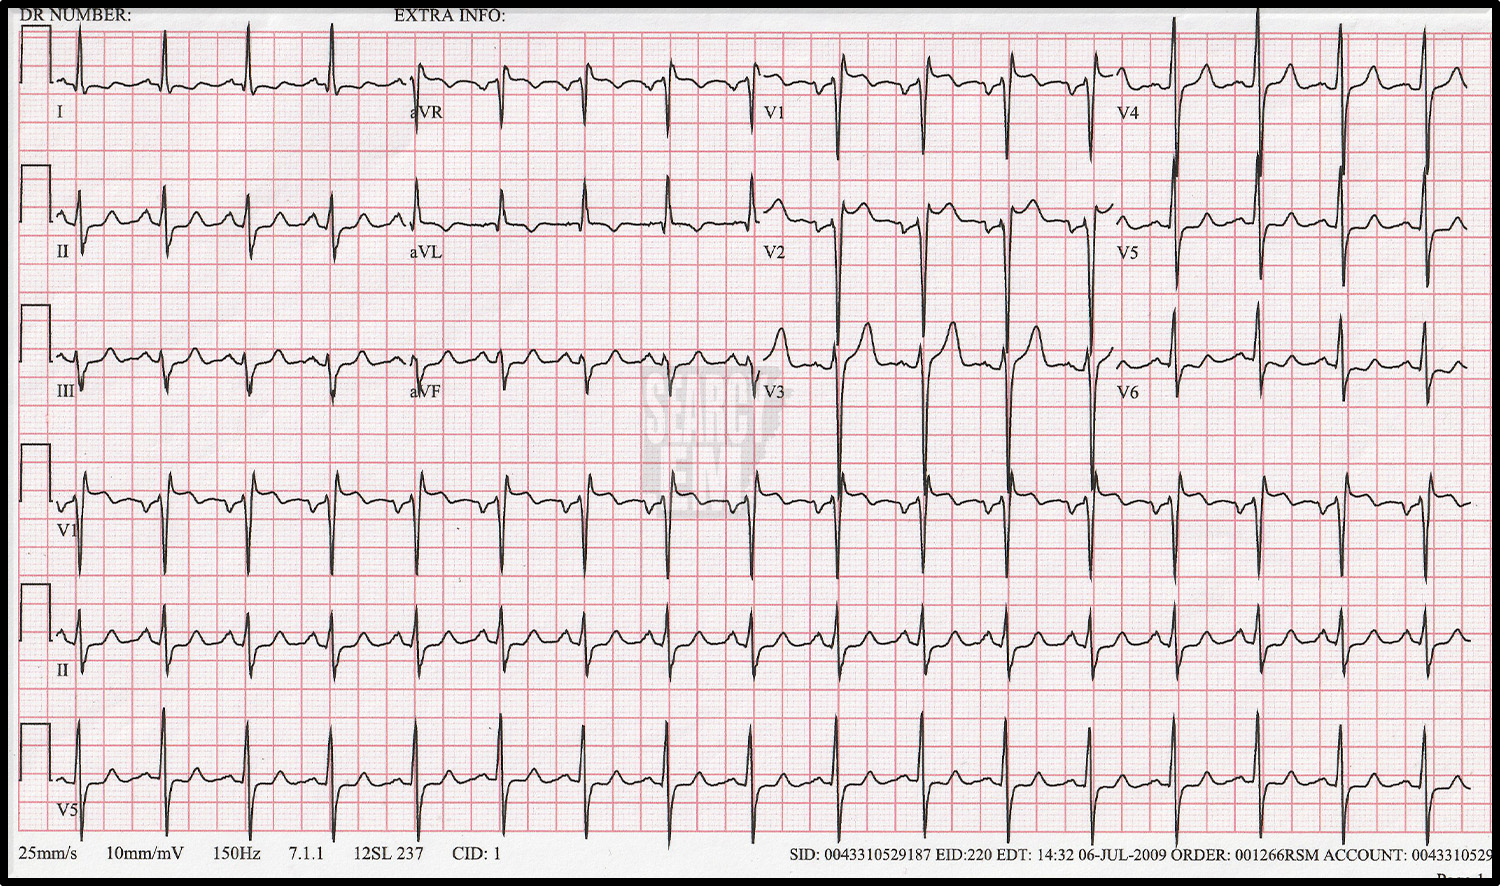
3 Interpreation
Sinus with RBBB
23 Interpretation
Sinus with RBBB and LAD, which is c/w anterior hemiblock: bifasicular block in the setting of RBBB.
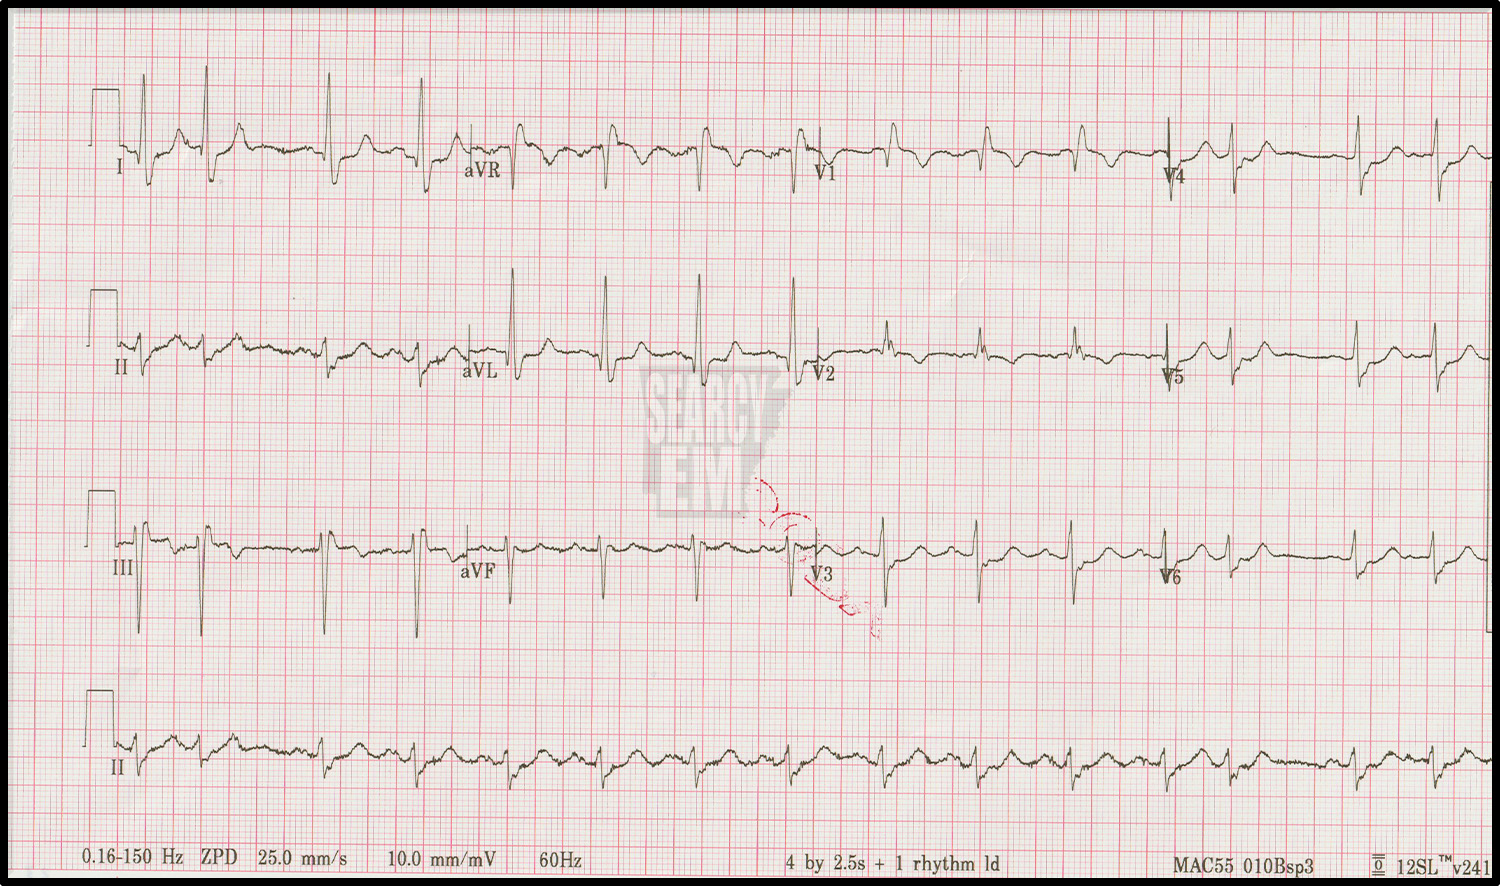
73 Interpretation
Sinus with Brugada type 2 pattern
43 Interpretation
Likely SVT. There are a few blips on the rhythm strip that could be p waves.

Same patient as above. The paper speed was increased from the standard 25mm/sec to 50mm/sec to see if there were actually any P waves. There were not. This is SVT.

51 Interpretation
Third Degree AV block
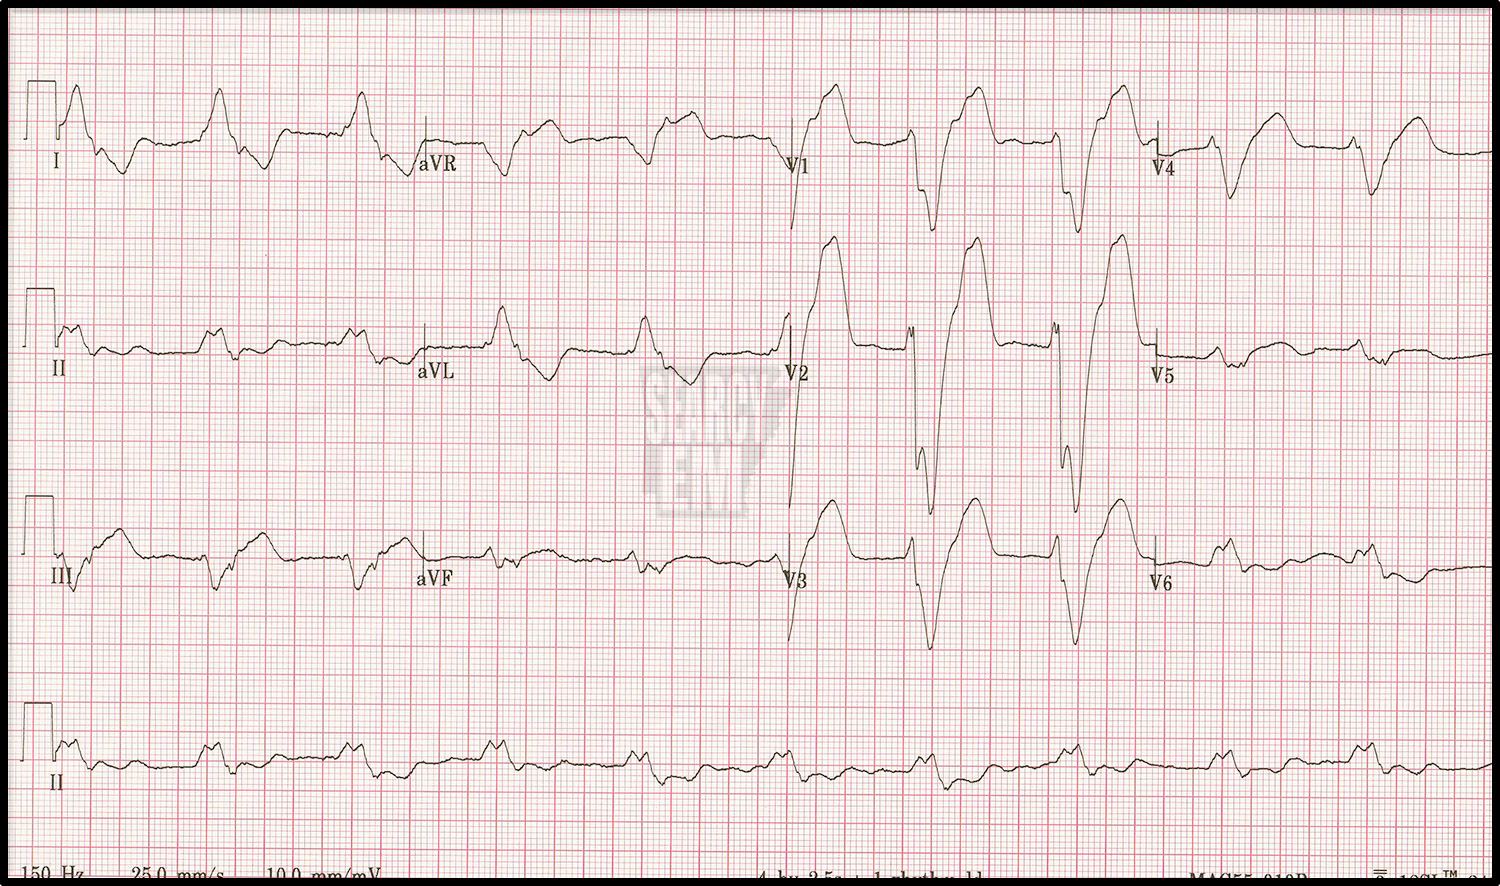
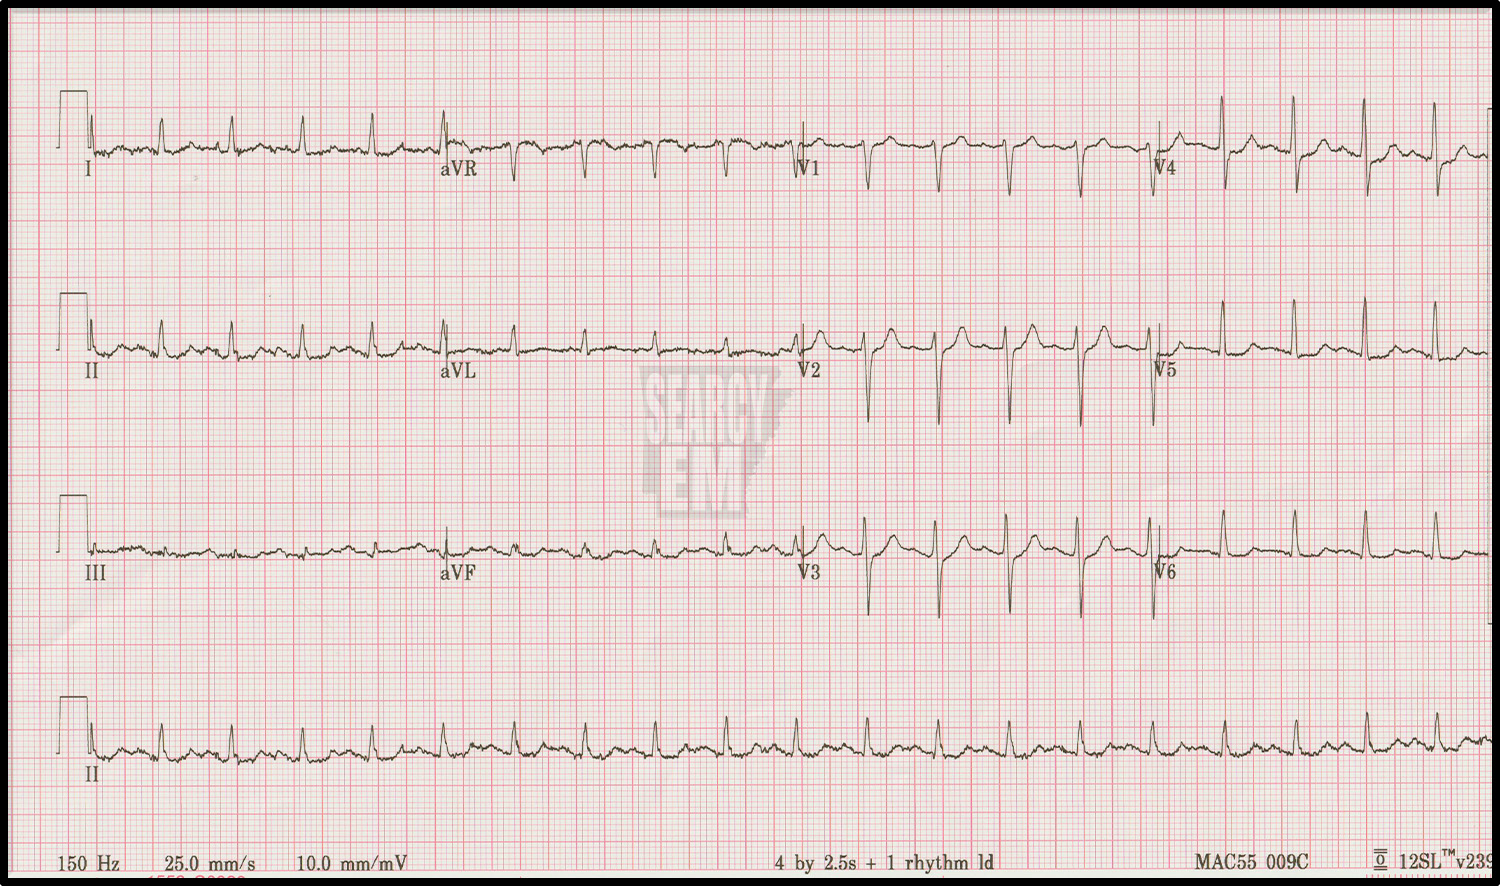
30 Interpretation
Very Wide QRS complex. no P waves. Hyperkalemia.

Sinus with RBBB and LAD. Same patient as EKG 30 after calcium was given for the hyperkalemia.

62 Interpretation
Wide QRS with peaked T waves. Sinus. Left axis deviation. Hyperkalemia

same patient as 62 after treating the hyperkalemia
2 Interpretation
Normal

8 Interpretation
Normal EKG
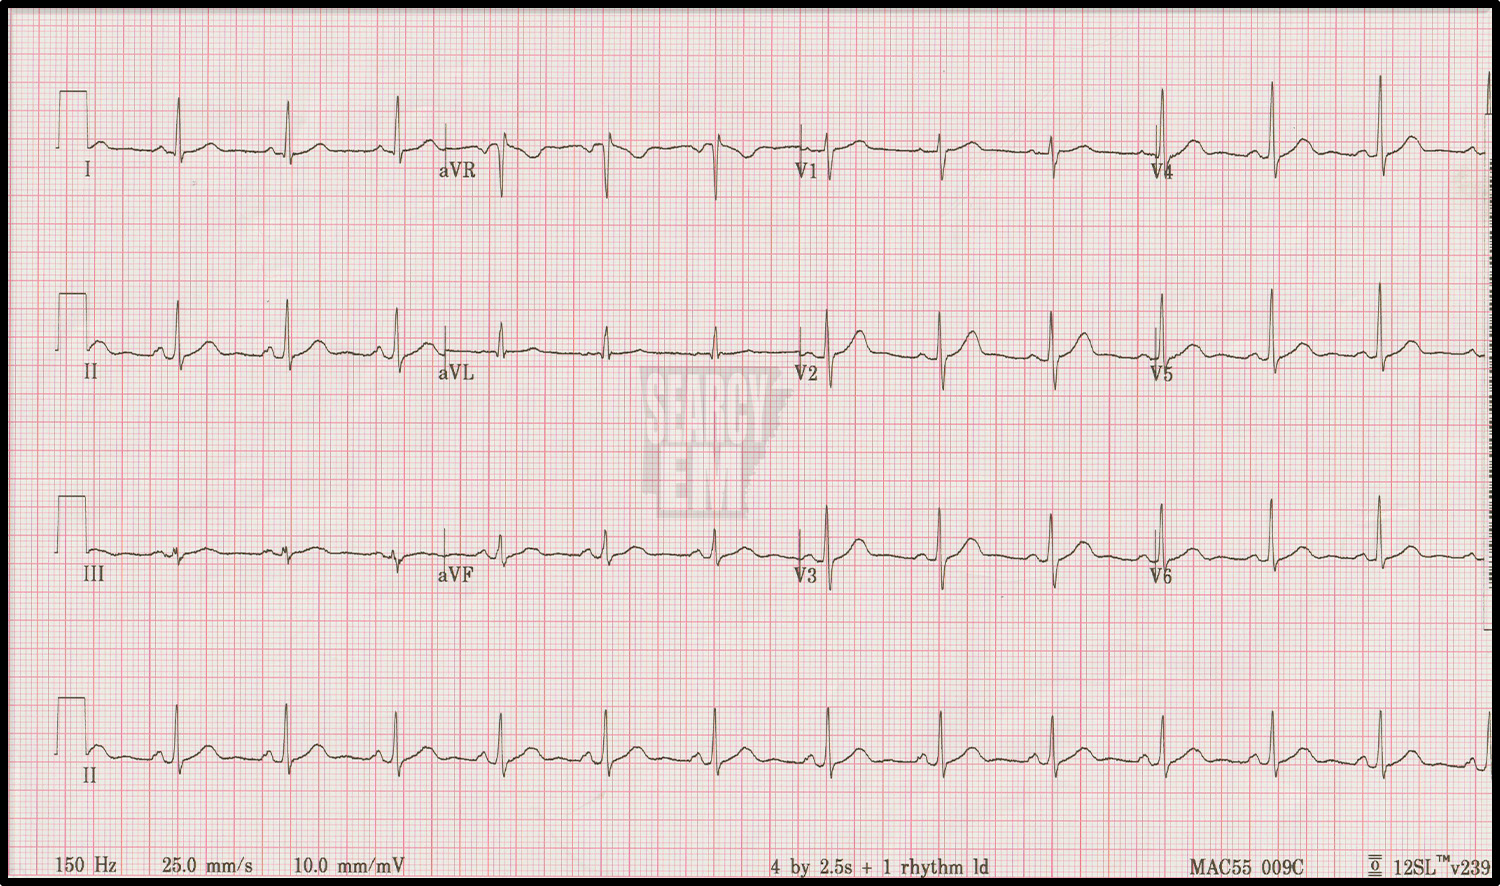
11 Interpretation
Normal EKG
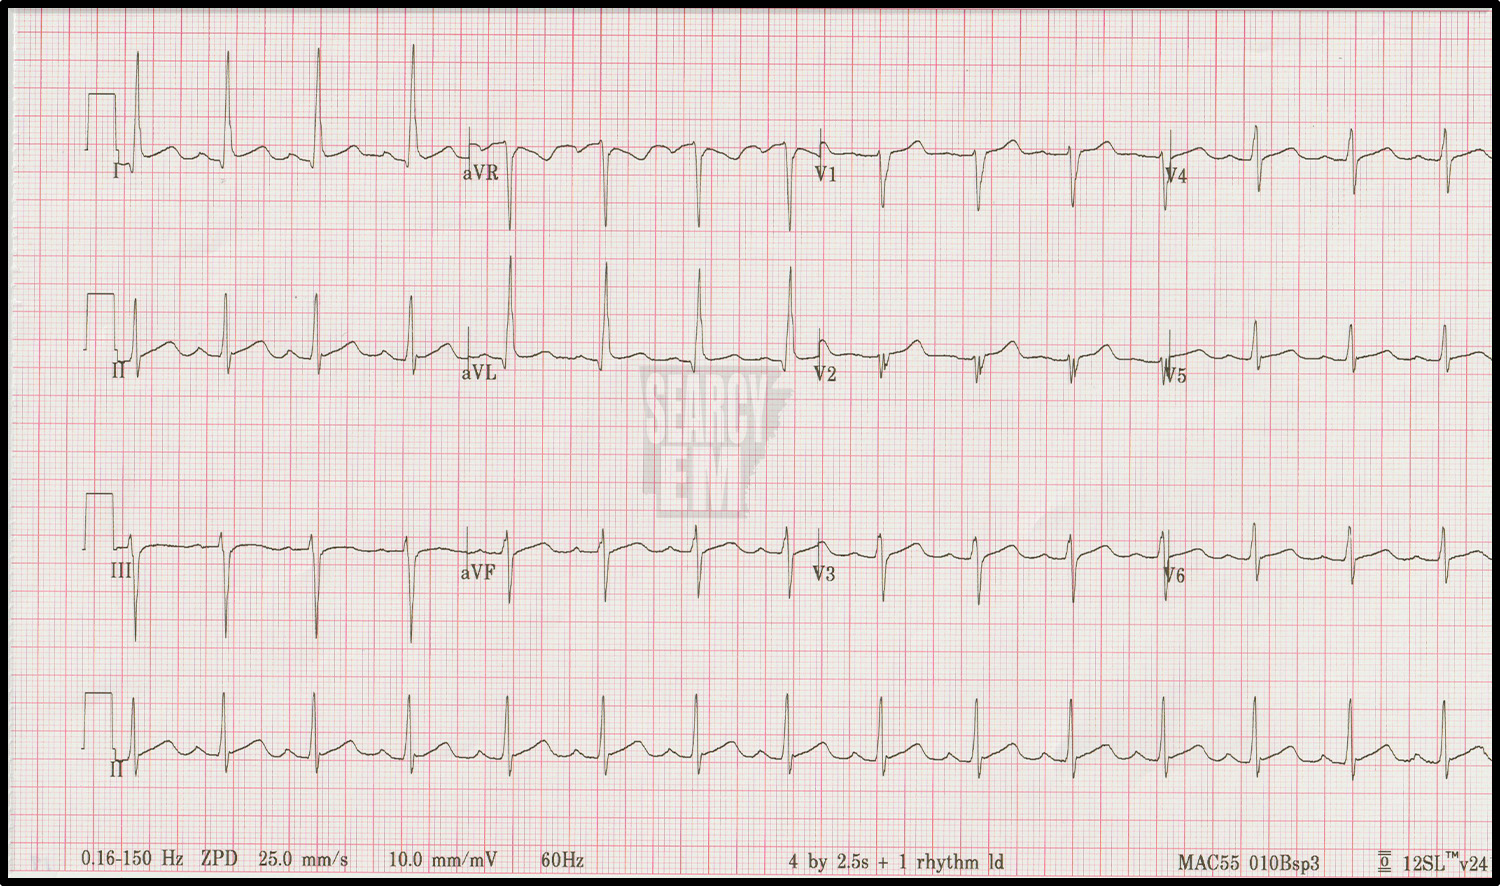

28 Interpretation
Normal sinus, ST depression in the anterior leads concerning for anterior ischemia vs posterior infarction

Same patient as 28. Here the Leads V4, 5, and 6 have been moved to the posterior positions (V7, 8, 9) and they do show elevation in leads V8 and V9. Notice that in this example, no one wrote the 7, 8, and 9 on the sheet, and the machine does not label the changes, so in retrospect there is no way to know that the leads had been moved to non-standard positions. If you do atypical lead positions, be sure to label them!
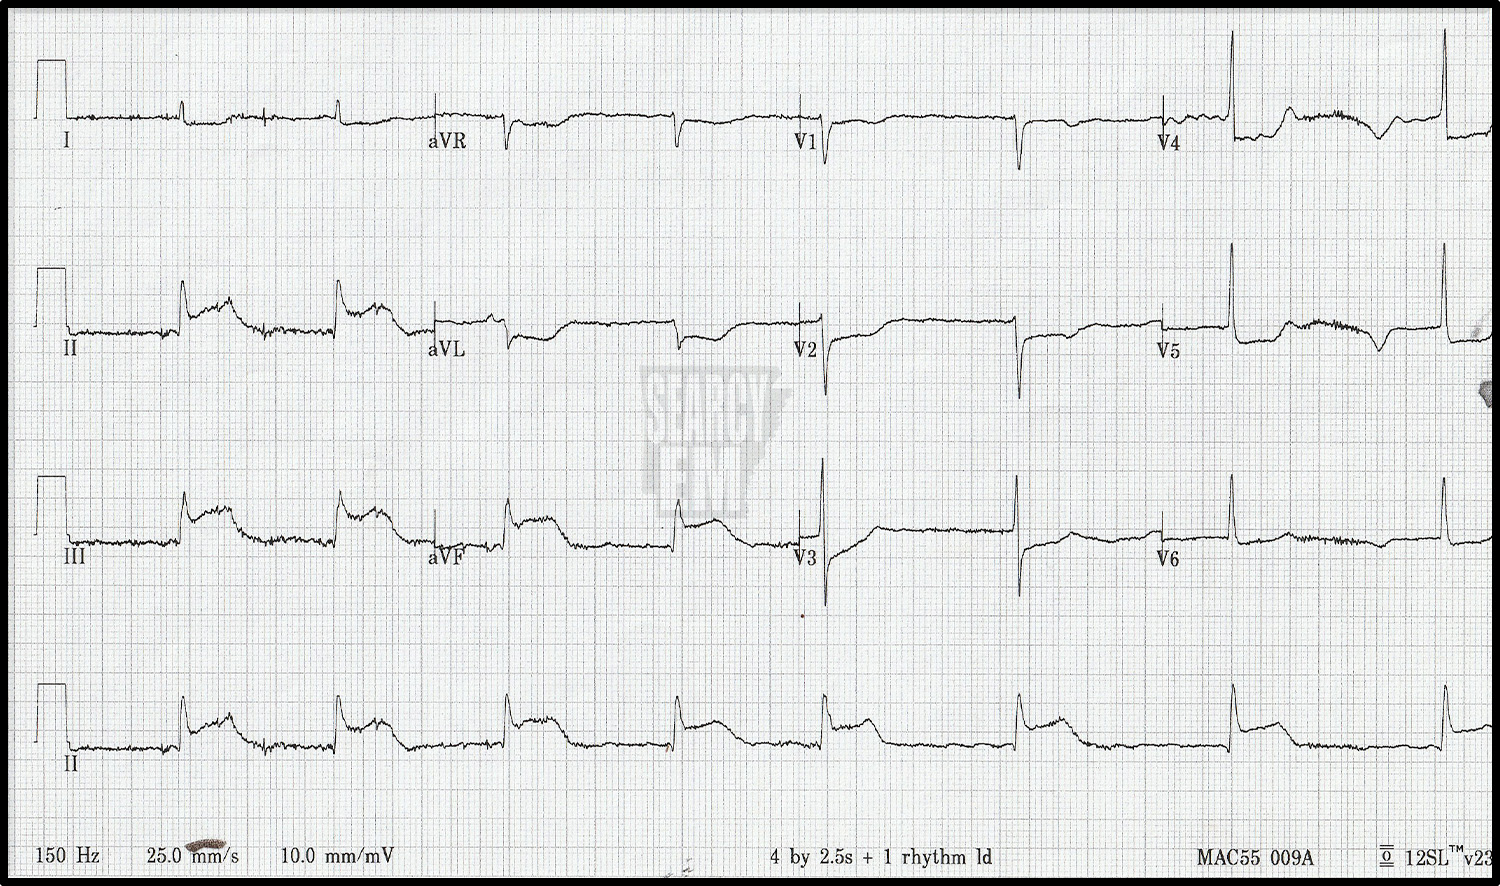
54 Interpretation
P waves are difficult to see. This could be sinus or a junctional escape rhythm. Thre is ST elevation in the inferior leads and depression in the anterior leads: STEMI
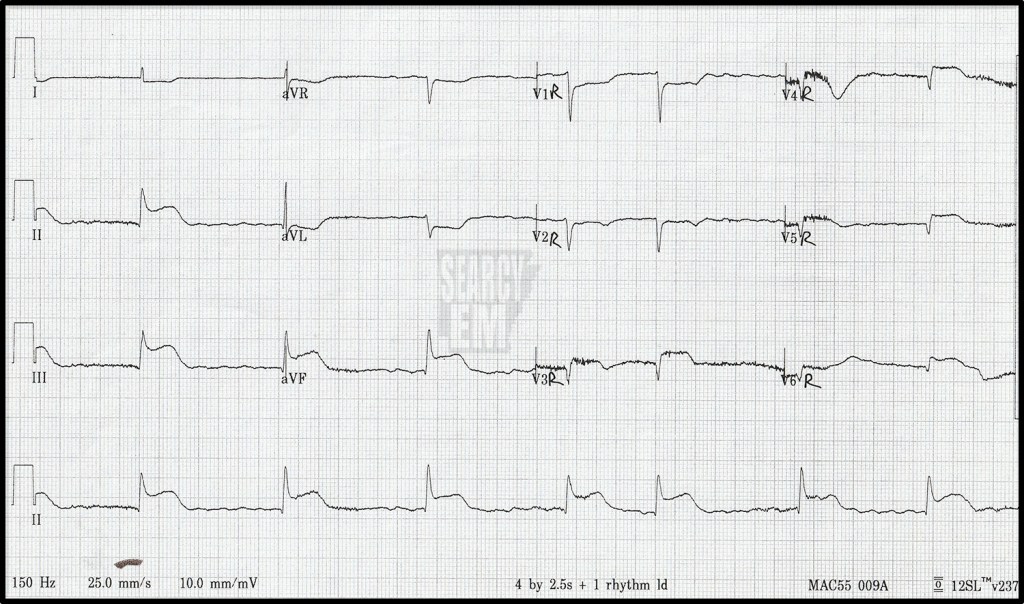
Same patient as 54. In this tracing the precordial leads (V1-6) have been turned around to the right and now represent leads V1R – V6R. We see elevation throughout these leads, but most importantly we see elevation in V4R, whihc is the most specific lead for Right Ventricular Involvement in the setting of an inferior wall MI. Of note, there was a STEMI on the first EKG. The cath lab could have been activated based on that. The right sided leads provide extra information in terms of how preload dependant the patient might be, but you wouldn’t delay going to the cath lab pending a right sided EKG. This is similar, but different to doing posterior leads in the setting of anterior ST depression. In that case, there is no “STEMI” until you see the STE in the posterior leads, so that is necessary for making the diagnosis. In this case, the diagnosis of STEMI, is already made. This is extra information.
52 Interpretation
WPW
