
Interpretation 9
Normal

25 Interpretation
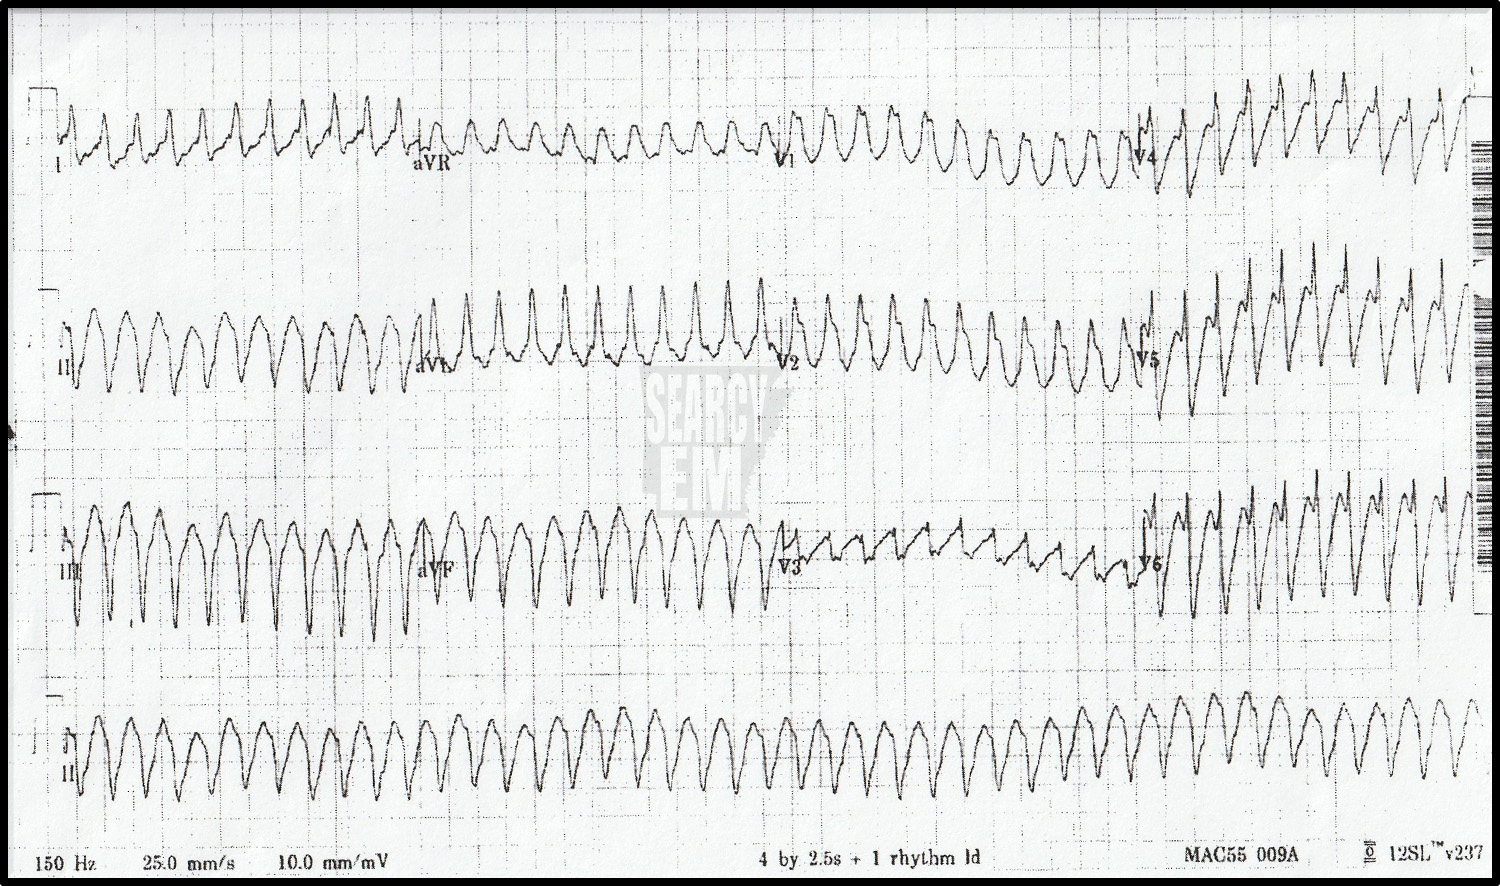
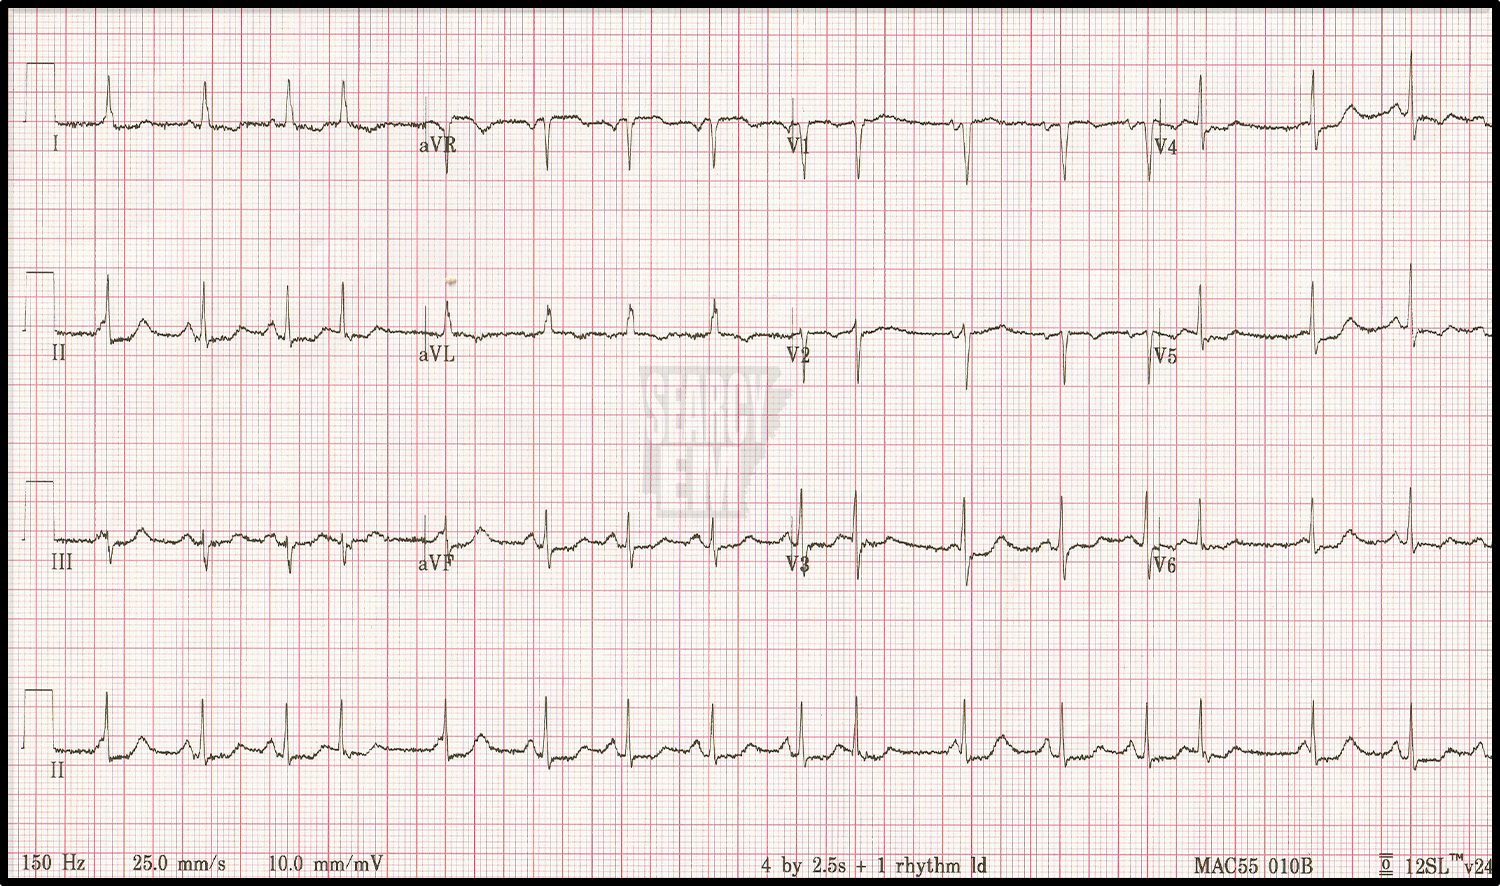
Antidromic SVT in WPW – although without the history of WPW, we could not have known that at the bedside. Other possibilities are SVT with aberancy, and VT.
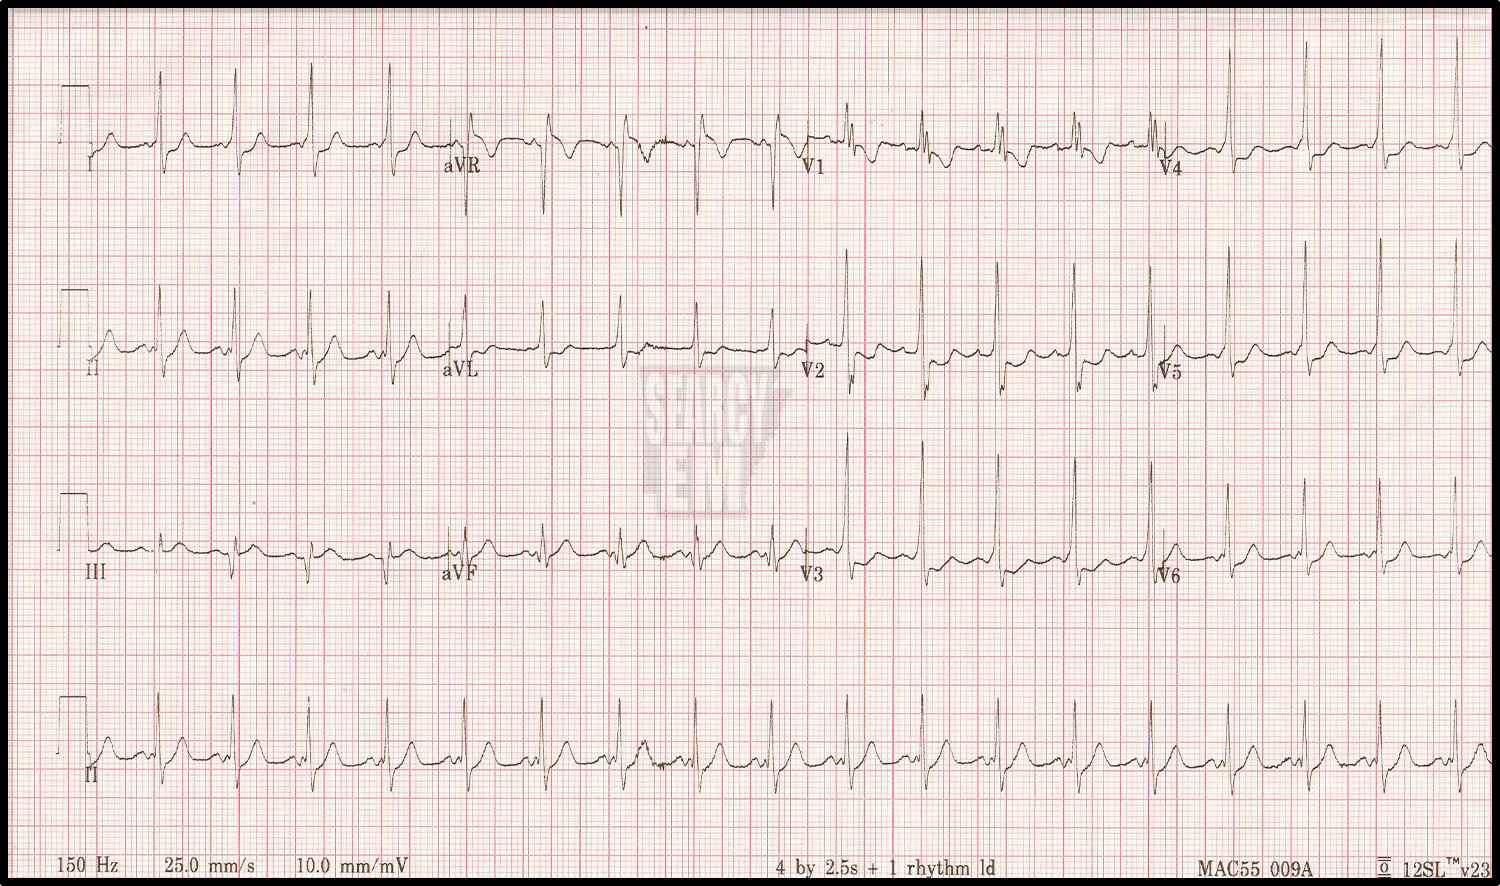
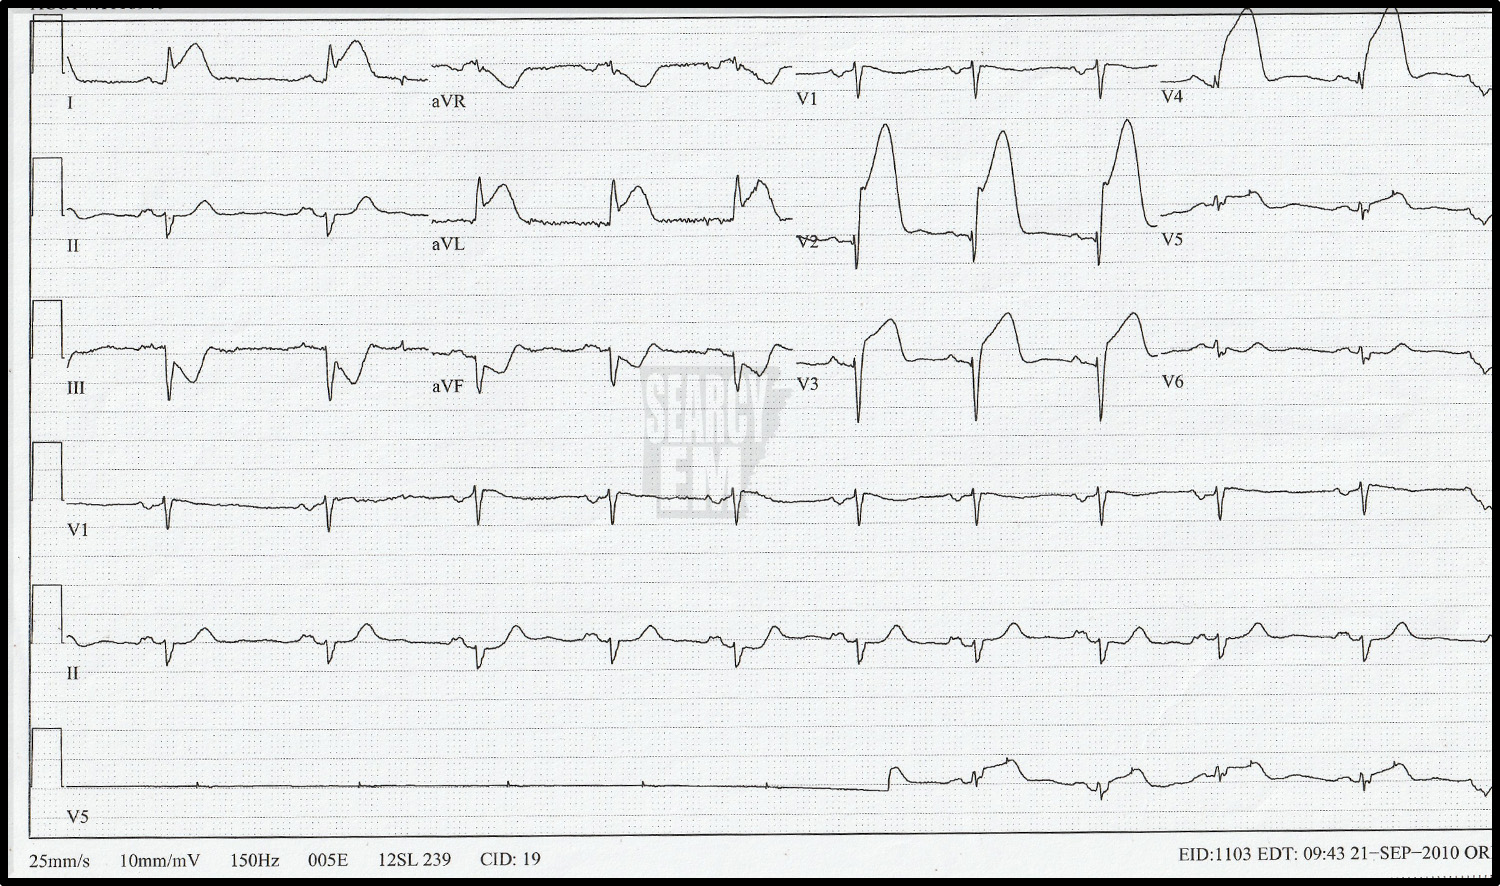
This is the same patient as in the prior ECG after cardioversion. Notice the prominent delta waves in V3, V4, and V5 along with the short PR interval. This is WPW, which makes the prior ECG likely to be antidromic SVT.
49 Interpretation
VT

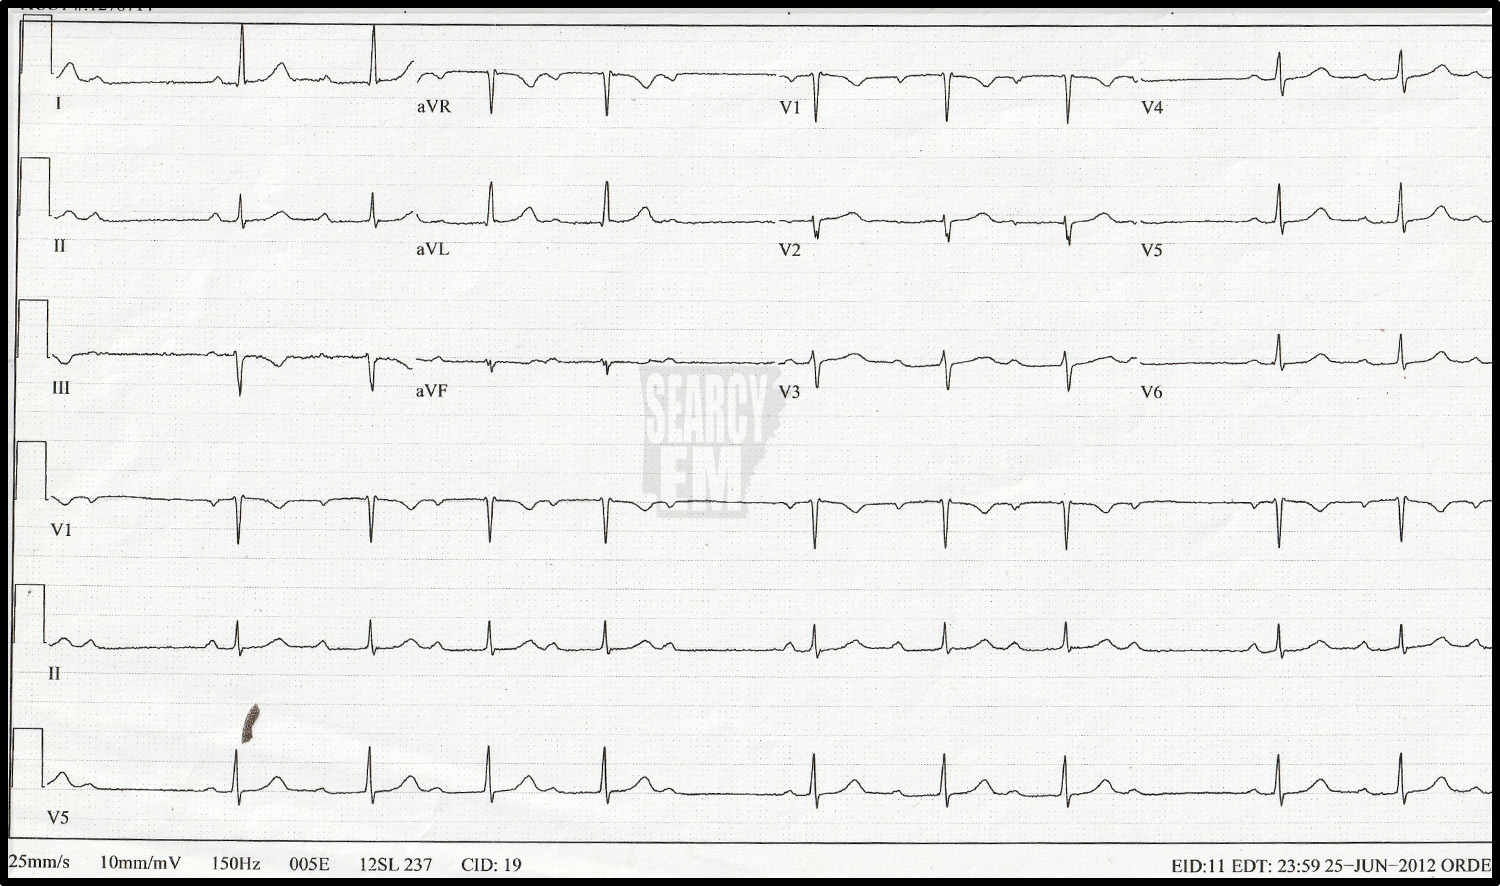
Same patient as the prior ECG after cardioversion. No ischemic changes noted.

64 Interpretation
VT
60 Interpretation
Mobitz 1 AV block (Wenchebach)

16 Interpretation
RBBB with left axis deviation = bifasicular block: RBBB + anterior hemiblock
4 Interpretation
RBBB

47 Interpretation
Brugada Pattern

45 Interpretation
Down in 1, up in R. This is concerning for limb lead misplacement
Same patient as ECG 45, now with the leads in the proper position. Up in lead I, and down in aVR is much more likely to be the accurate reading.

5 Interpretation
Normal

17 Interpretation
Normal
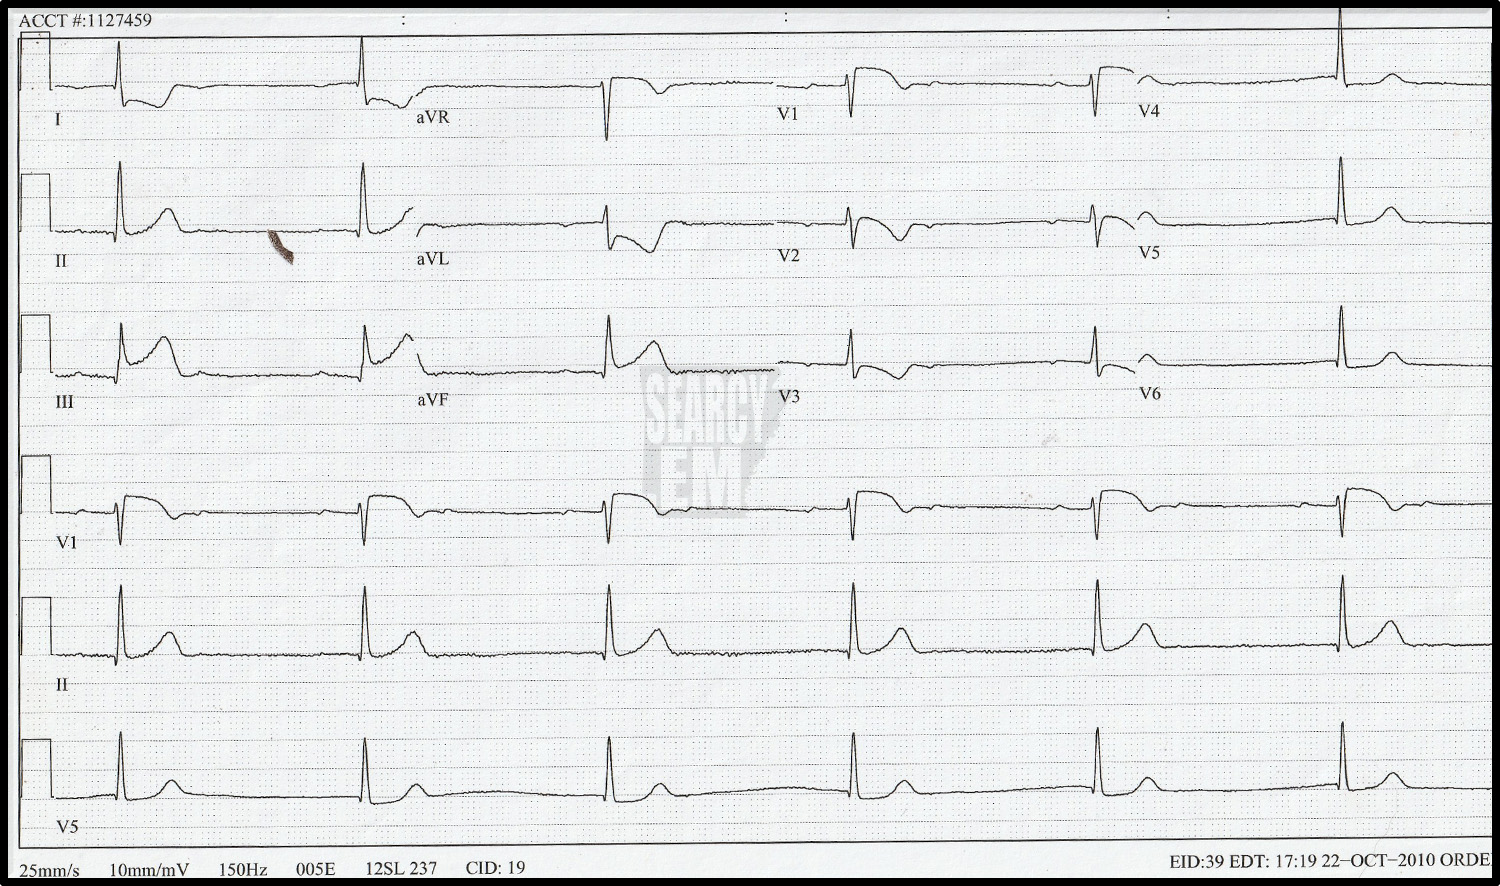
66 Interpretation
66: STE in the anterior leads with reciprocal depression in the inferior leads
20 Interpretation
Normal

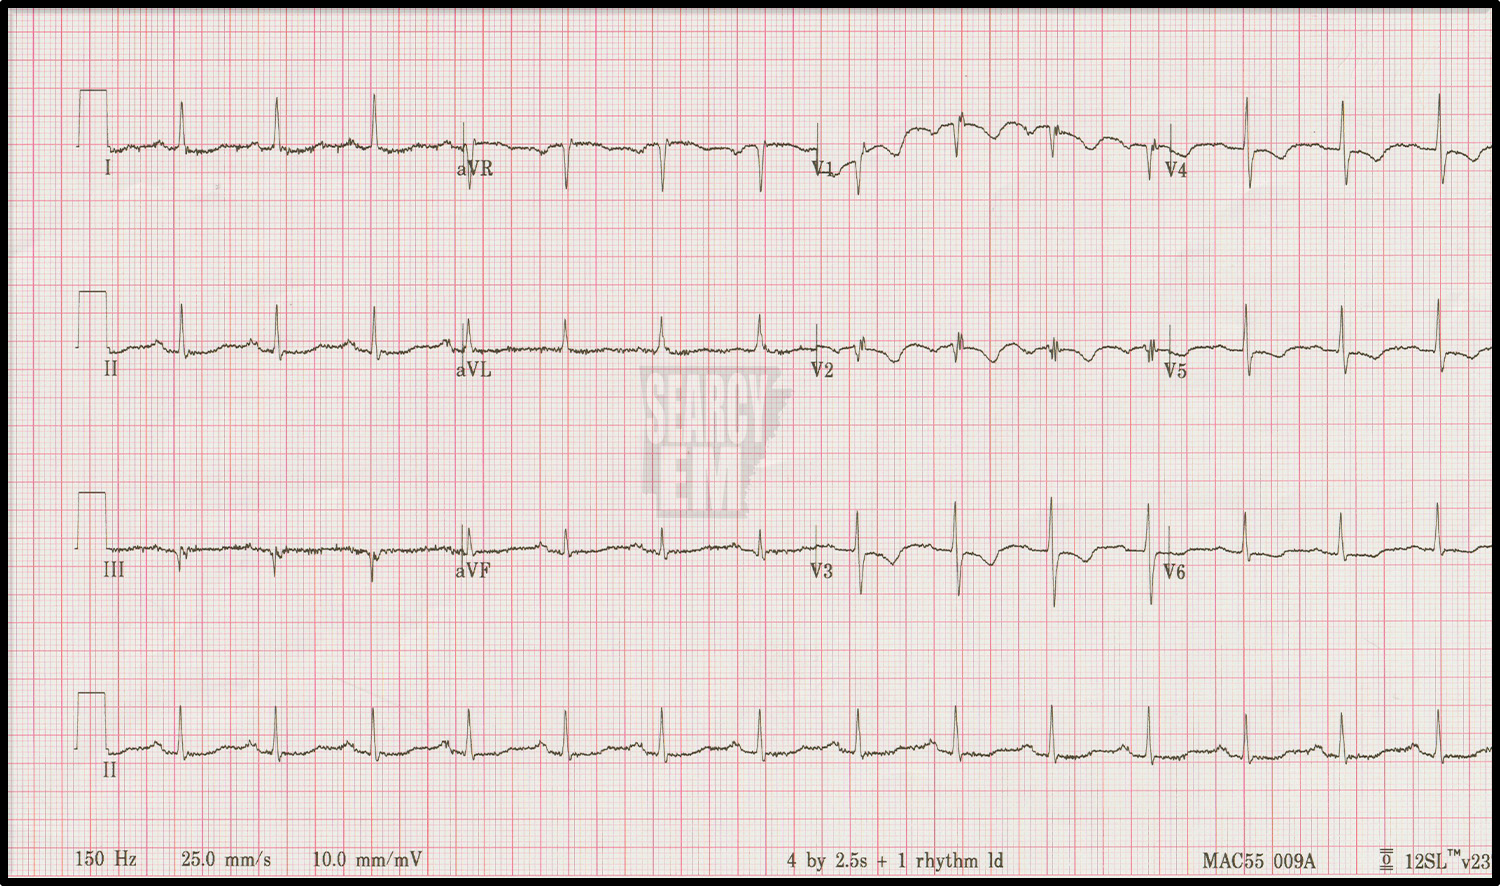
21 Interpretation
Normal sinus with PAC’s. the finding is how tall the P waves are in lead II. They are uniphasic. Since the right atrium depolarizes before the left, tall uniphasic P waves in lead II are caused by hypertophy of the right atrium. (Biphasic P waves are caused by left atrial enlargement). Right atrial enlargement is likely due to pathology of the tricuspid valve or high RV pressures, which themselves are usually due to high pulmonary aretery pressures.

6 Interpretation
Atrial sensed, ventricular paced rhythm
36 Interpretation
Mobitz 1 AV block (Wenchebach)
32 Interpretation
STE in V5 and V6. It looks unusual because ischemic STE is not usually seen after an S wave as it here. Another interesting point on this ekg is a PVC visible in leads V1-3. The PVC shows concordant ST depression in leads V2 and V3. That would meet Sgarbossa crieteria for an acute MI in the setting of LBBB. I don’t think that has been specifically shown to apply to PVCs, but I don’t know for sure. It’s concerning.

37 Interpretation
STE in the inferior leads with reciprocal depression in the anterior leads. Of note, not all inferior STE will show reciprocal depression.

42 Interpretation
STE in the anterior and lateral leads with reciprocal depression in the inferior leads. Of note, there is no elevation in V3. The only explanation is lead malpositioning. Unfortunately it is common to see lead V3 placed to the patient’s right of V2, that must be what happened here.
1 Interpretation
Normal

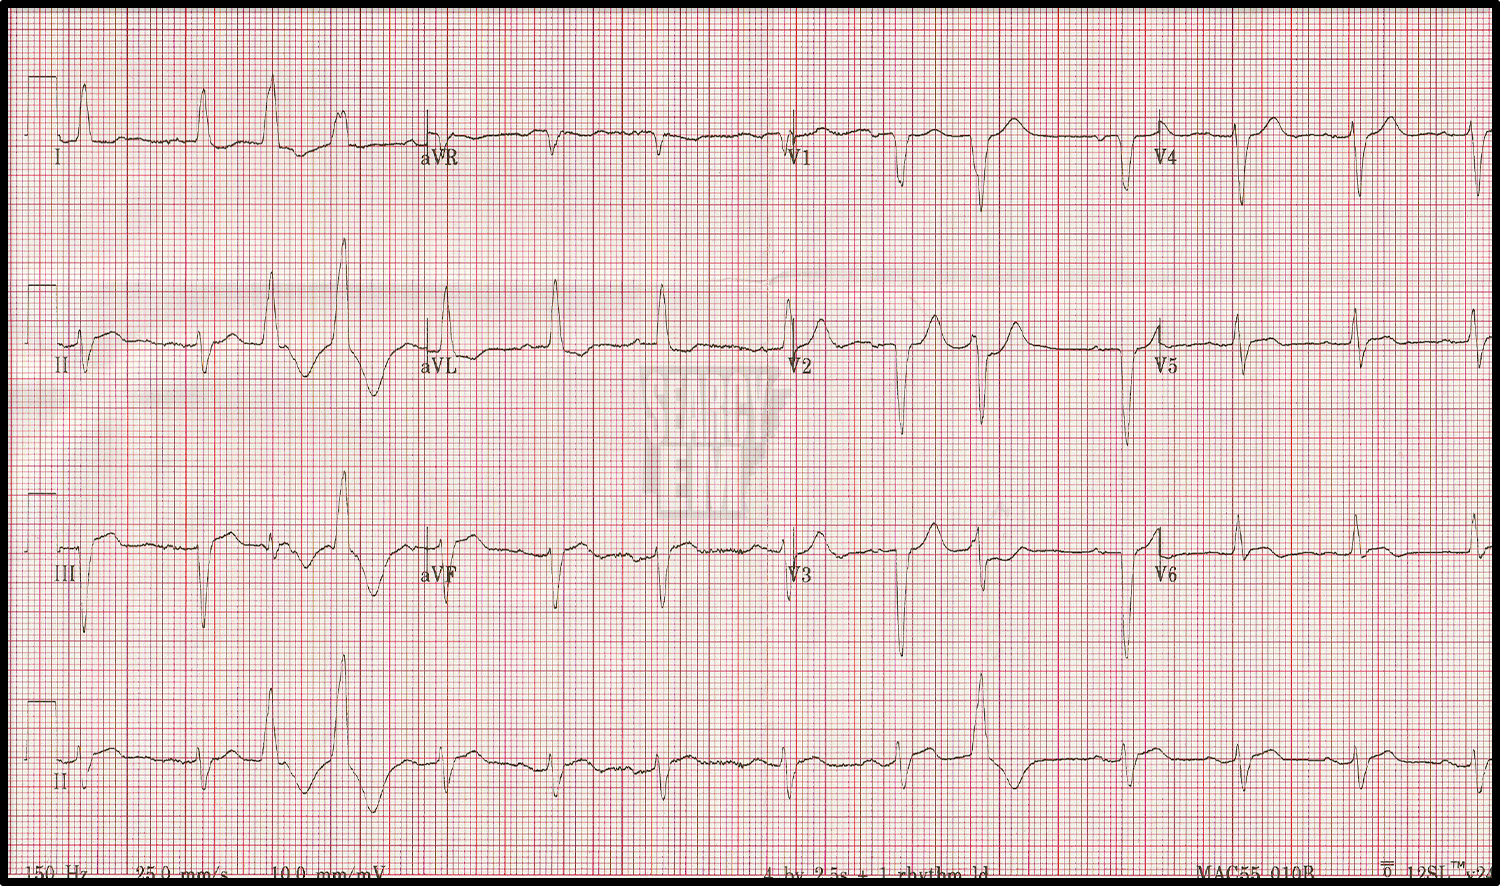
56 Interpretation
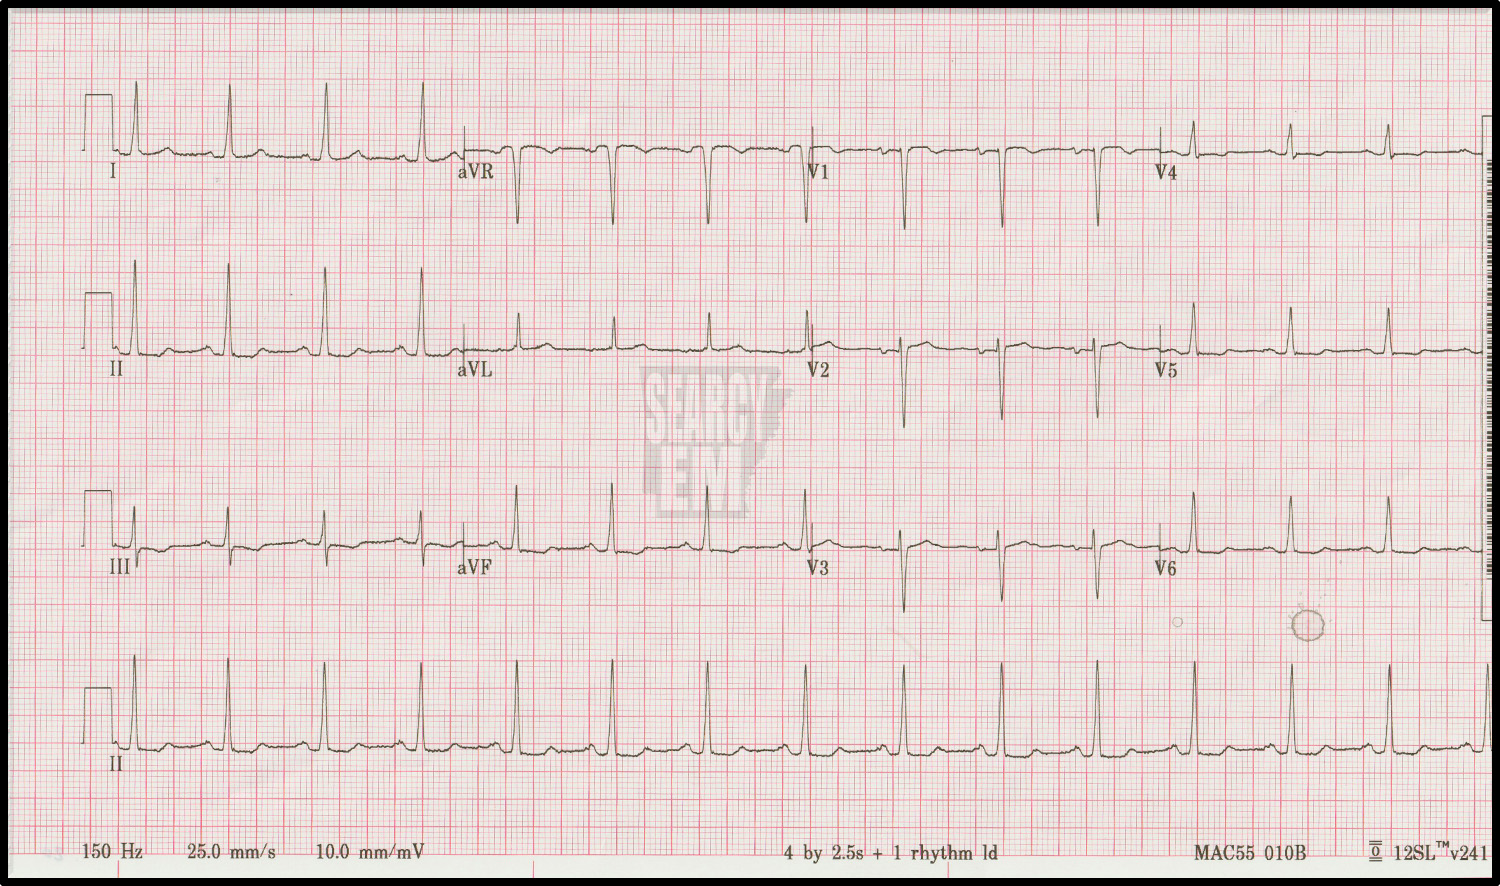
WPW. short PR with delta waves clearly visible in leads V1-V4.
59 Interpretation
STE elevation in the inferior leads. STE greater in lead III than lead II as well as STE in V1 (both highly suggestive of right ventricular involvment). Mobitz 2 AV block.
