I saw a 51-year-old man recently with hypotension and tachycardia. It got interesting.
HR 152, BP 70’s/40’s. Afebrile. He is awake and in no distress; he just didn’t feel well that day. He takes no medications and has no medical history.
We did a RUSH exam and expected to see a dynamic heart and a flat IVC. Those findings would have been consistent with distributive shock (e.g. sepsis) or hypovolemic shock. That’s not what we found, however.
Although he did not have beautiful ultrasound windows, we were able to see enough to make some decisions.
The apical 4 chamber view of the heart showed, as expected, a hyper-dynamic heart with a grossly normal ejection fraction.
The IVC, on the other hand, did not fit the picture we were expecting. It was not flat. In fact, it showed very little respiratory variation at all.
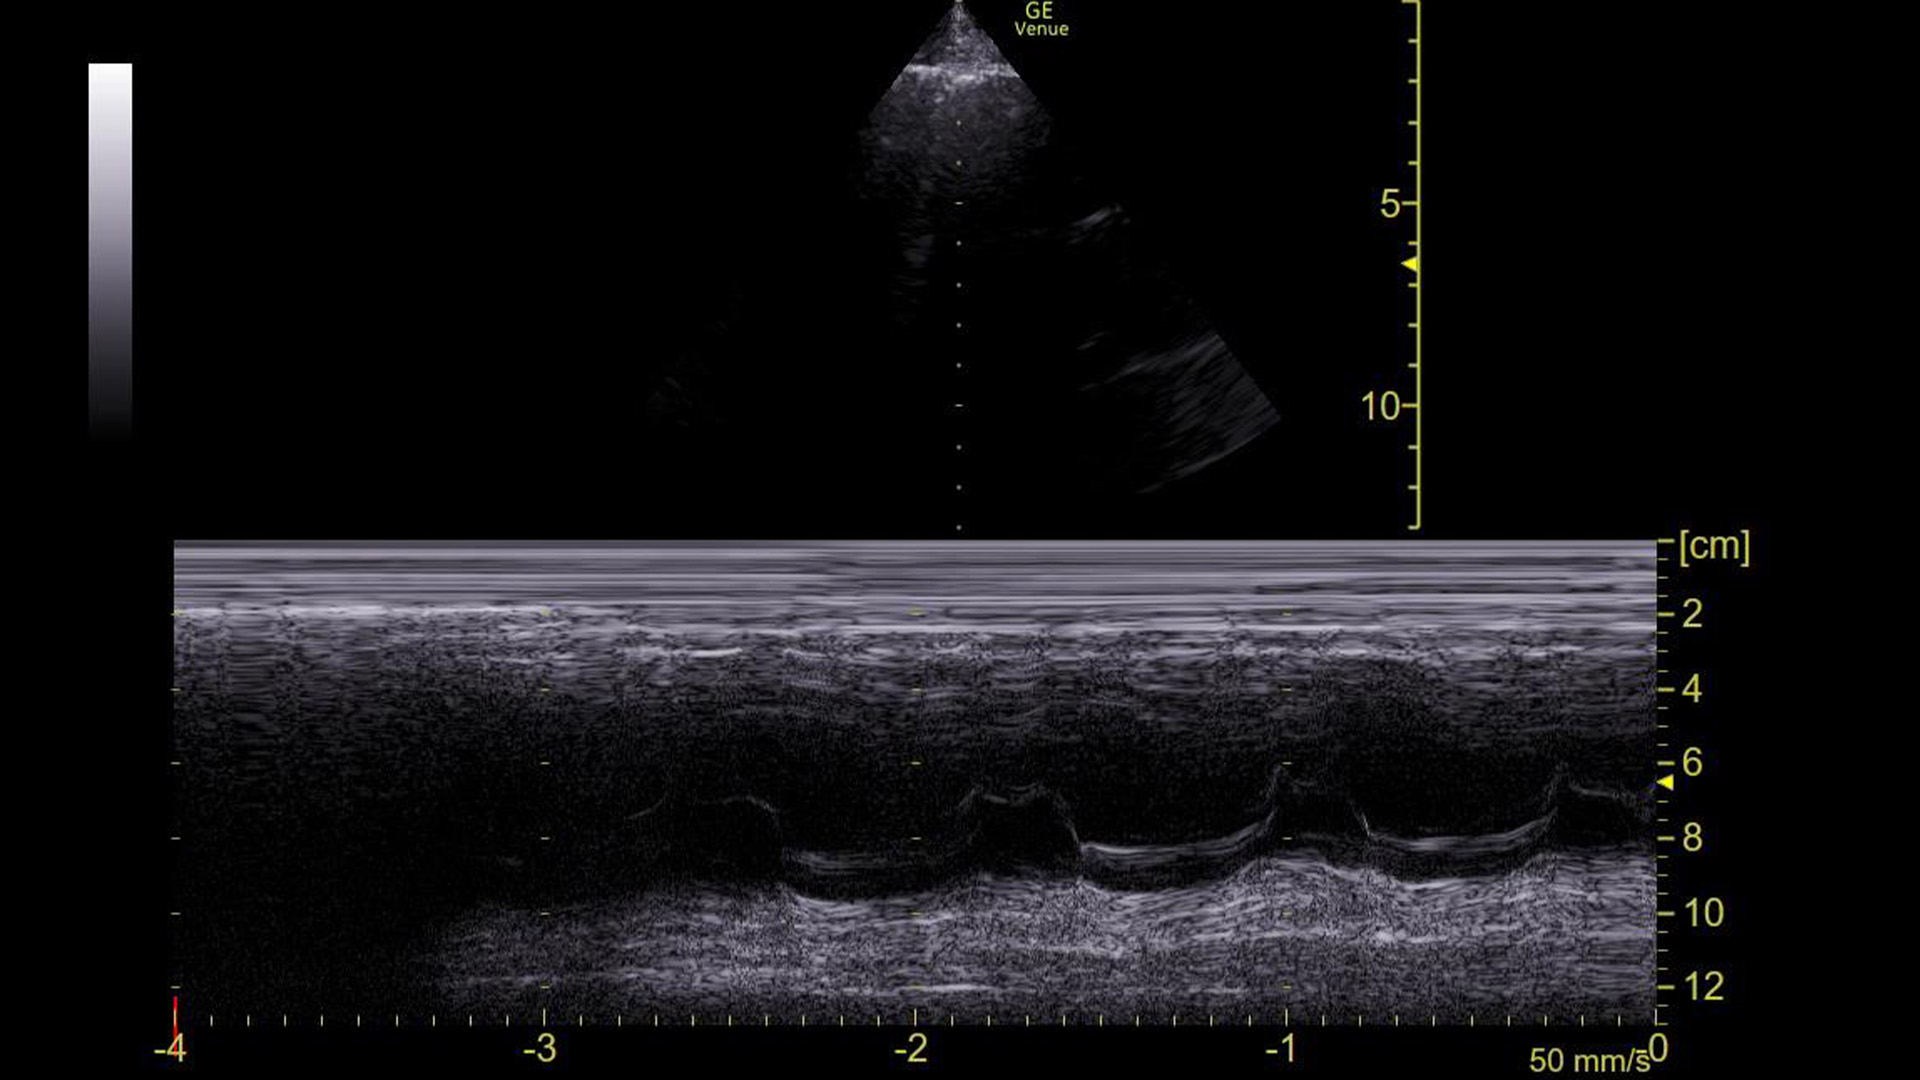
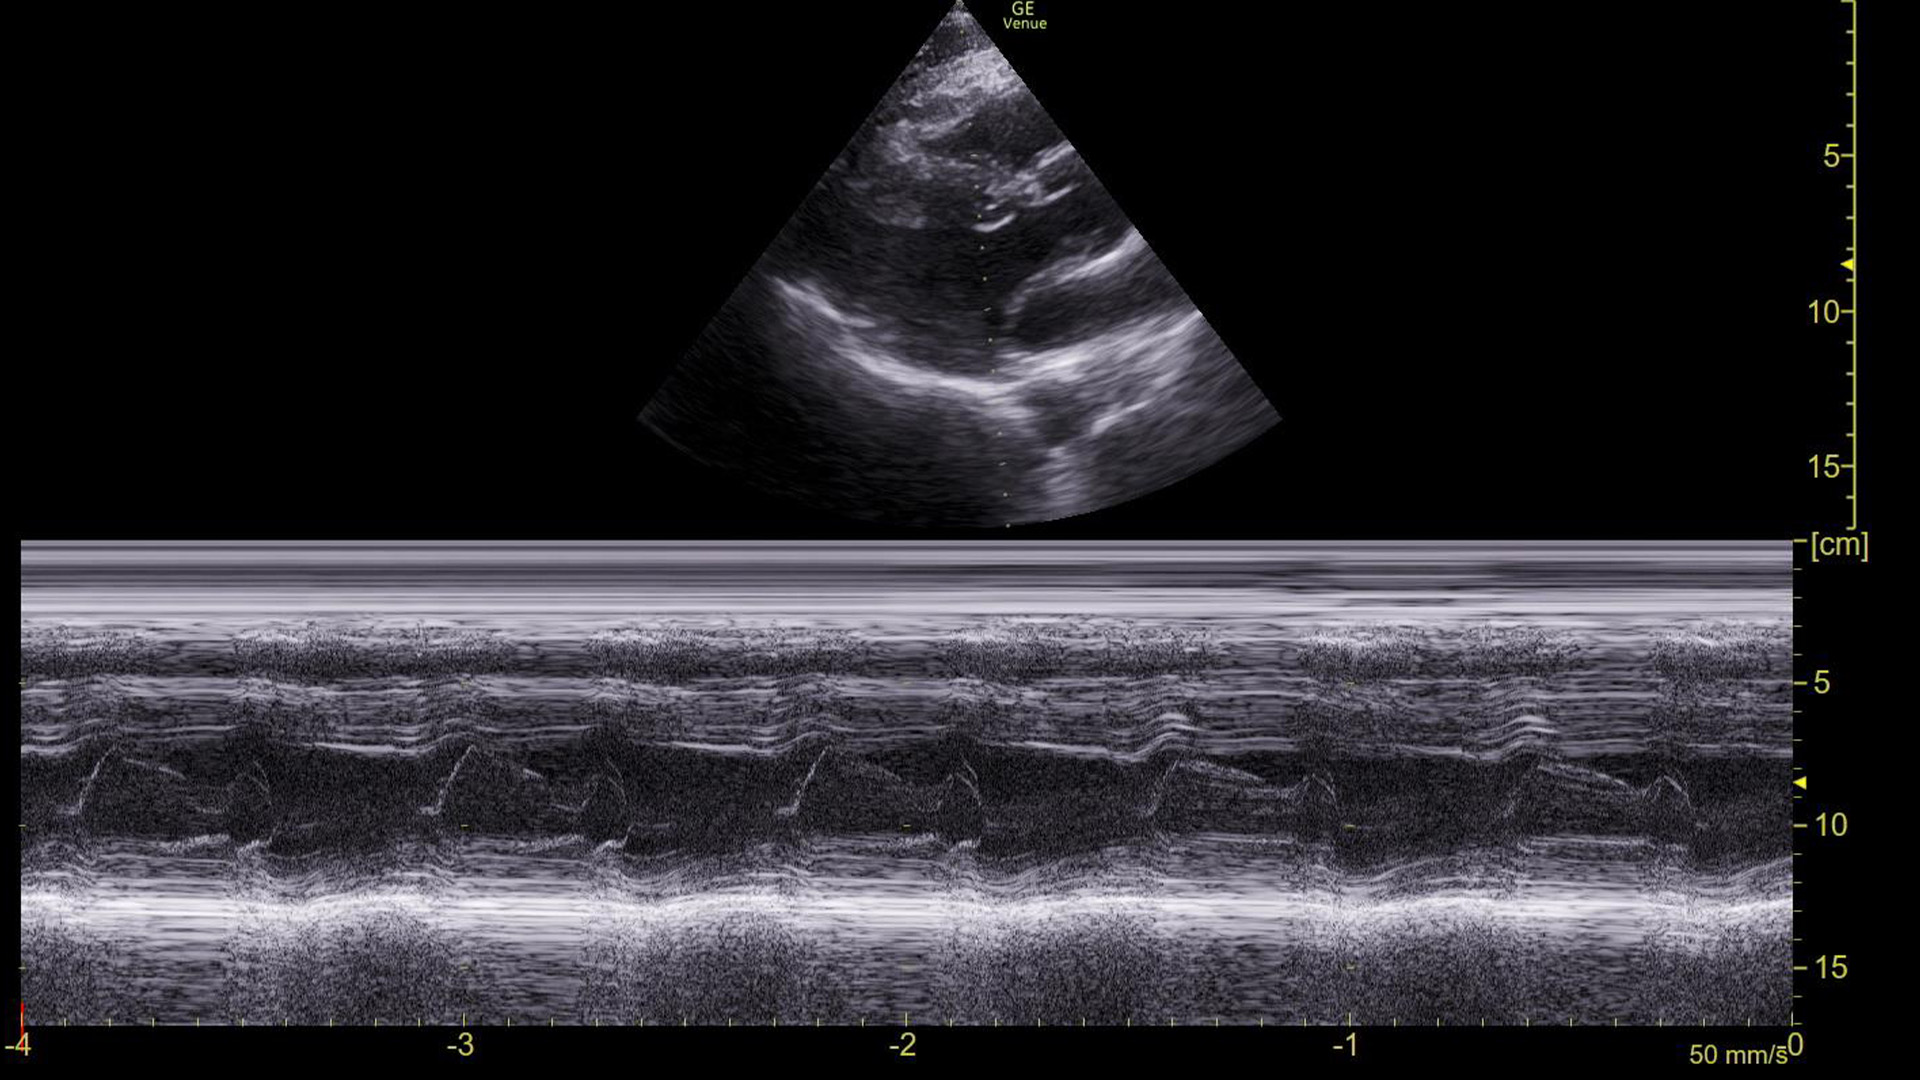
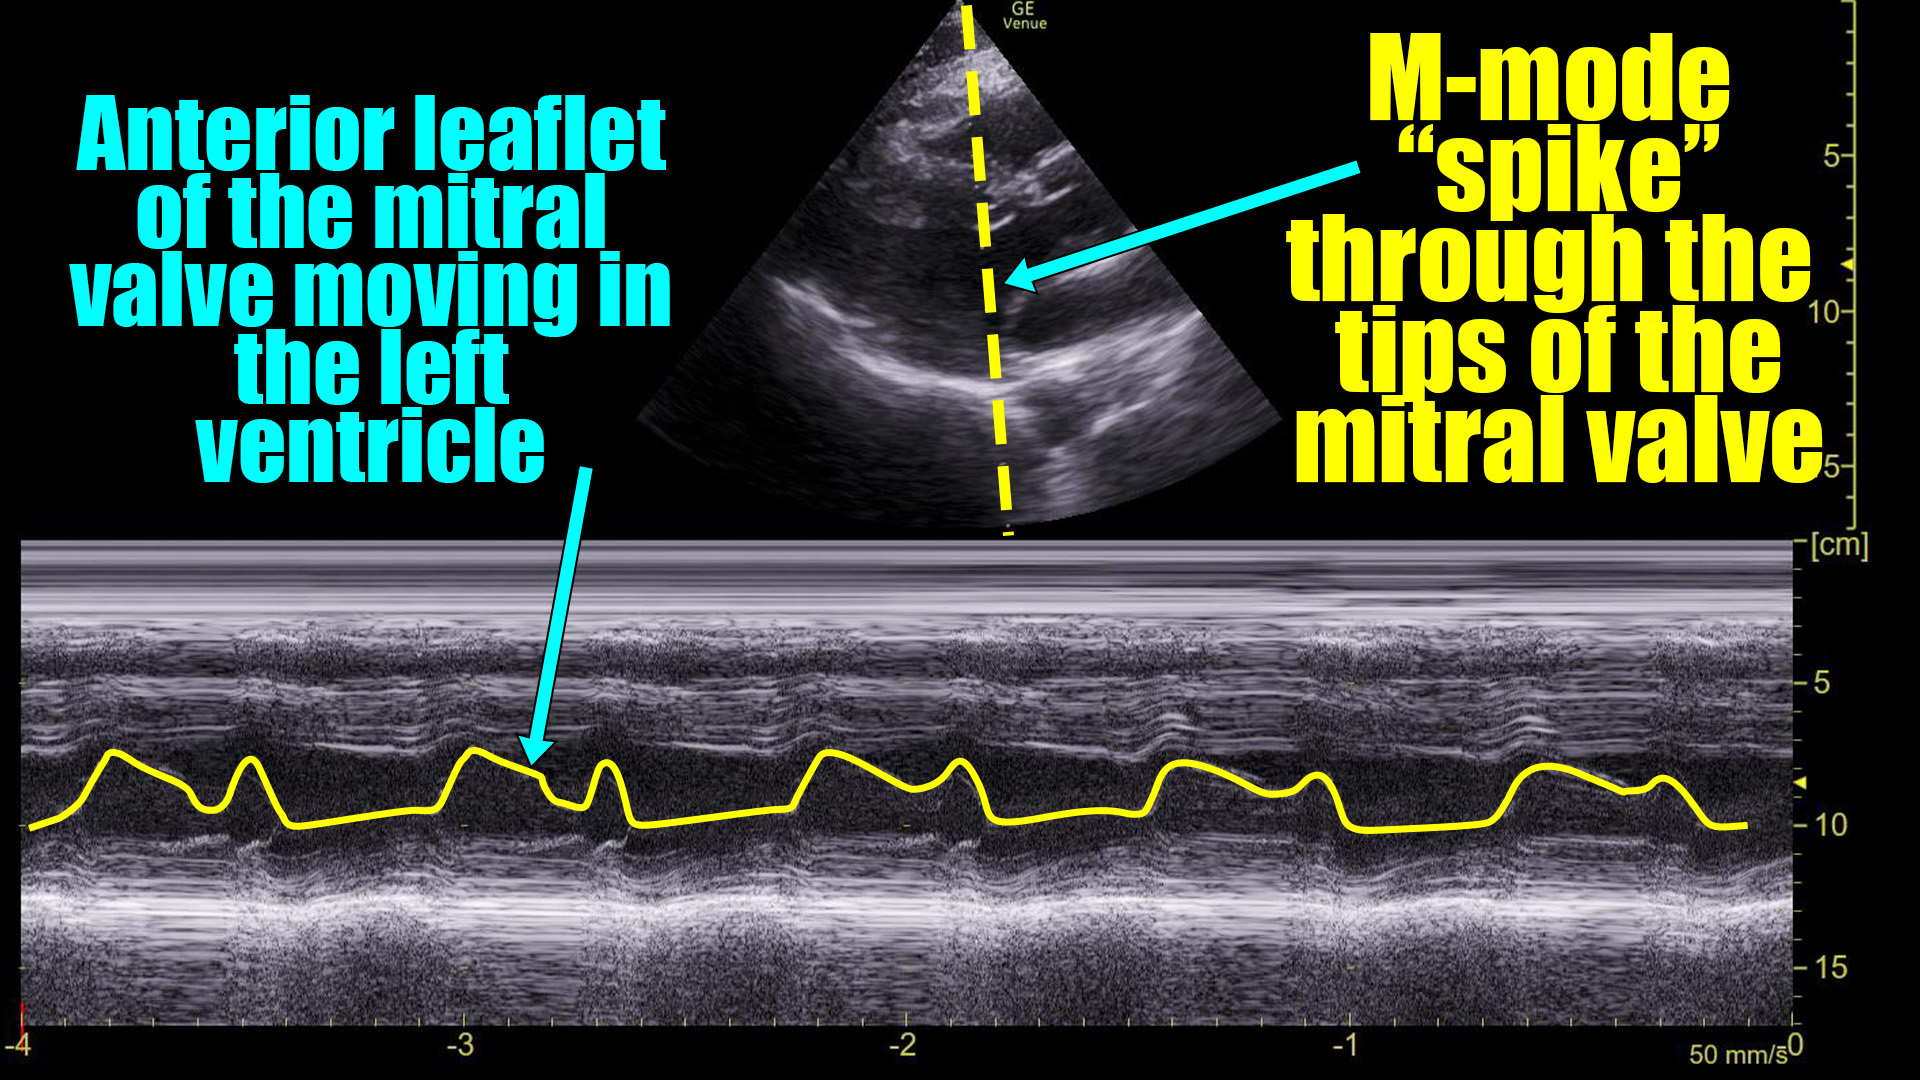
The machine read the ECG as sinus tachycardia, but I had my doubts. So, we obtained this M-mode tracing with the spike over the mitral valve in a parasternal long axis view.
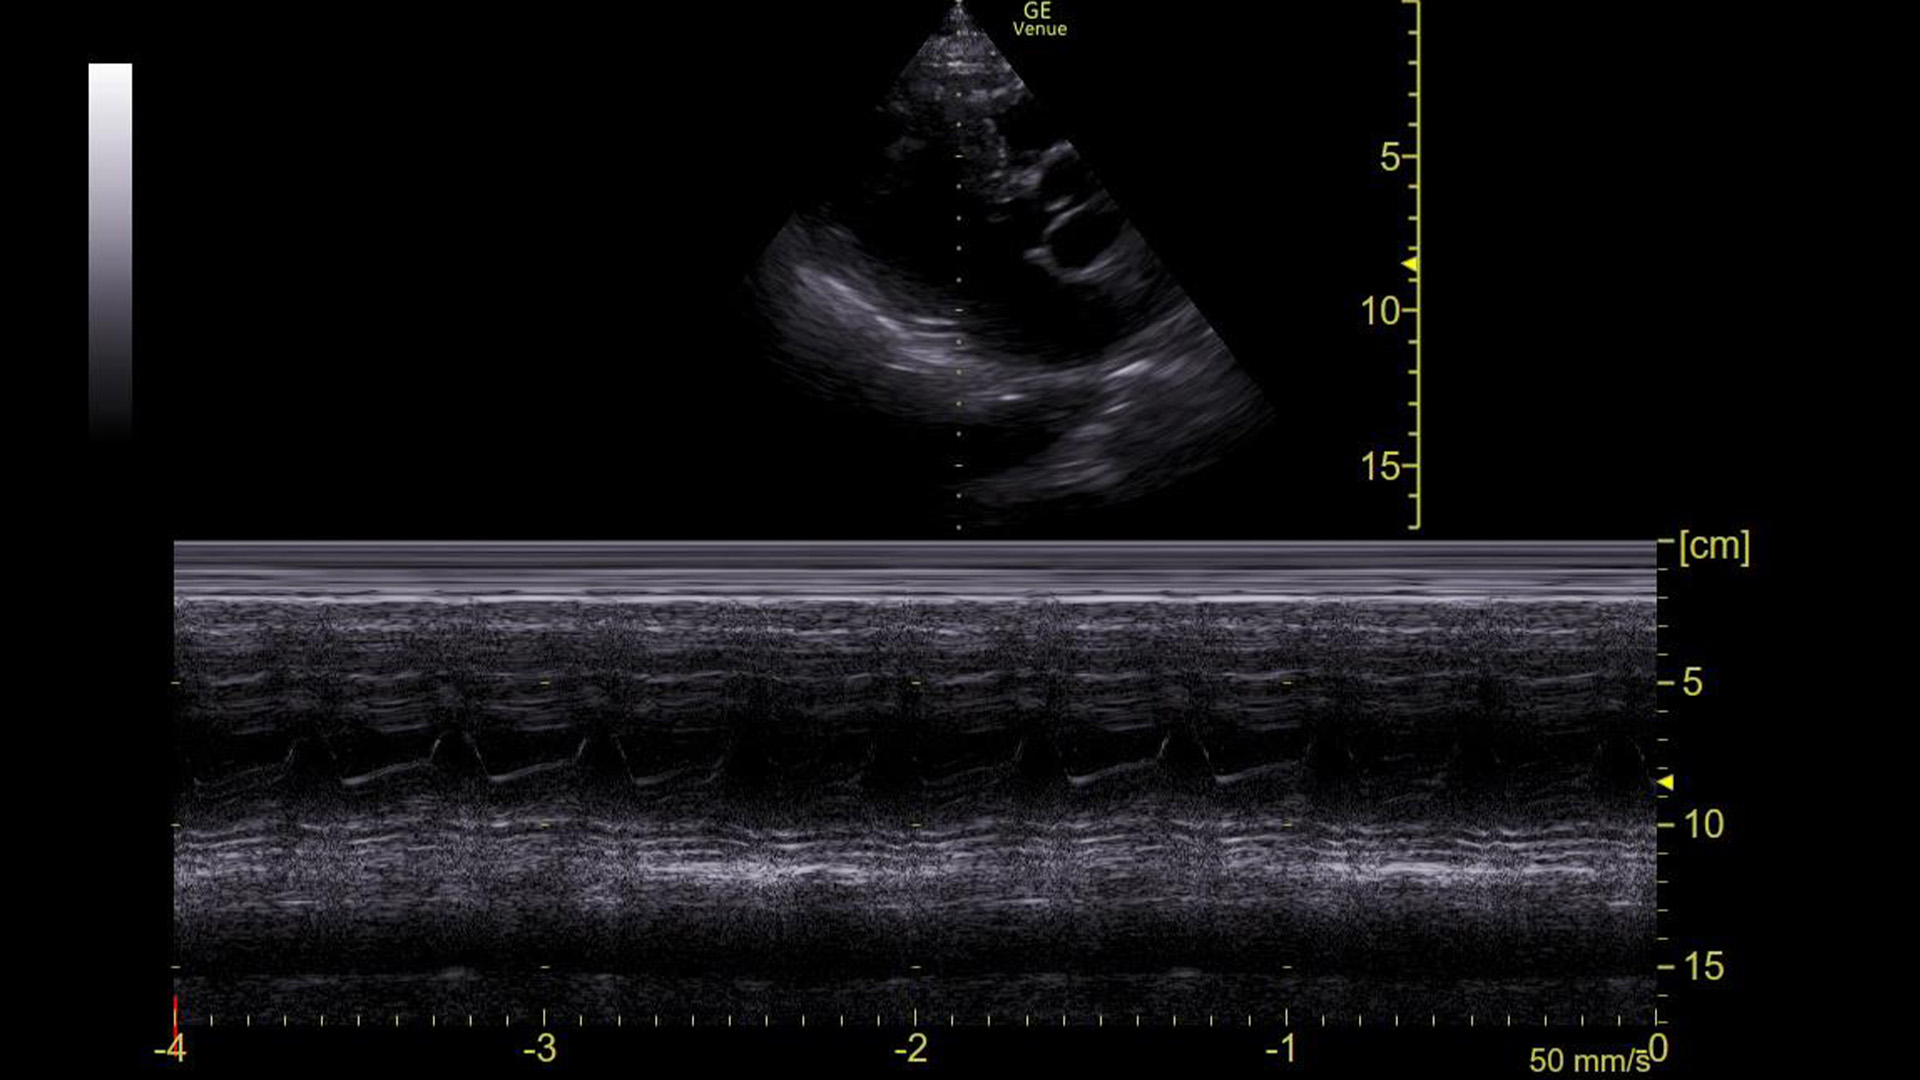
This made it clear that he was in an arrhythmia. The rate was 153, so we assumed it is atrial flutter with 2:1 conduction, but just based on this image and the narrow QRS complex on the ECG, it could have been SVT or a strangely regular atrial fibrillation.
The question is, how did we know that based on this tracing?
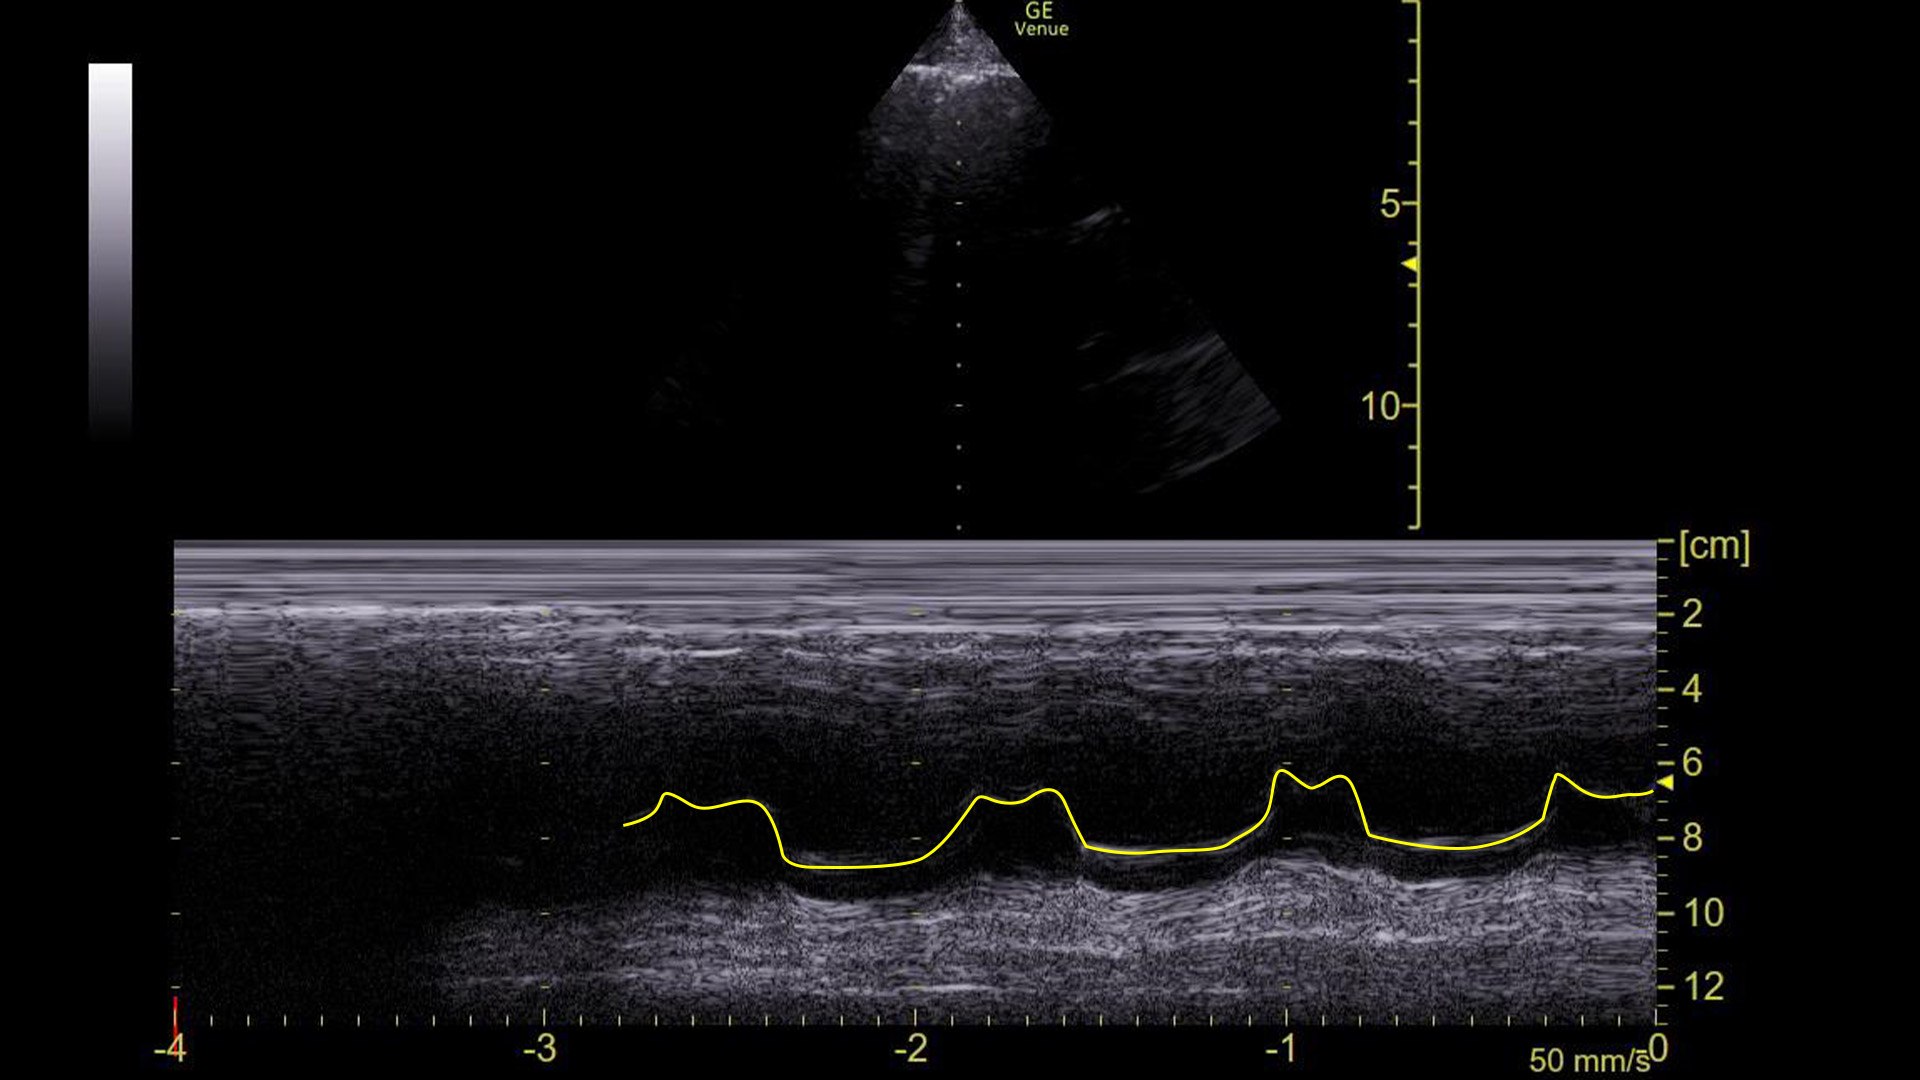
Here it is with the area of interest highlighted.
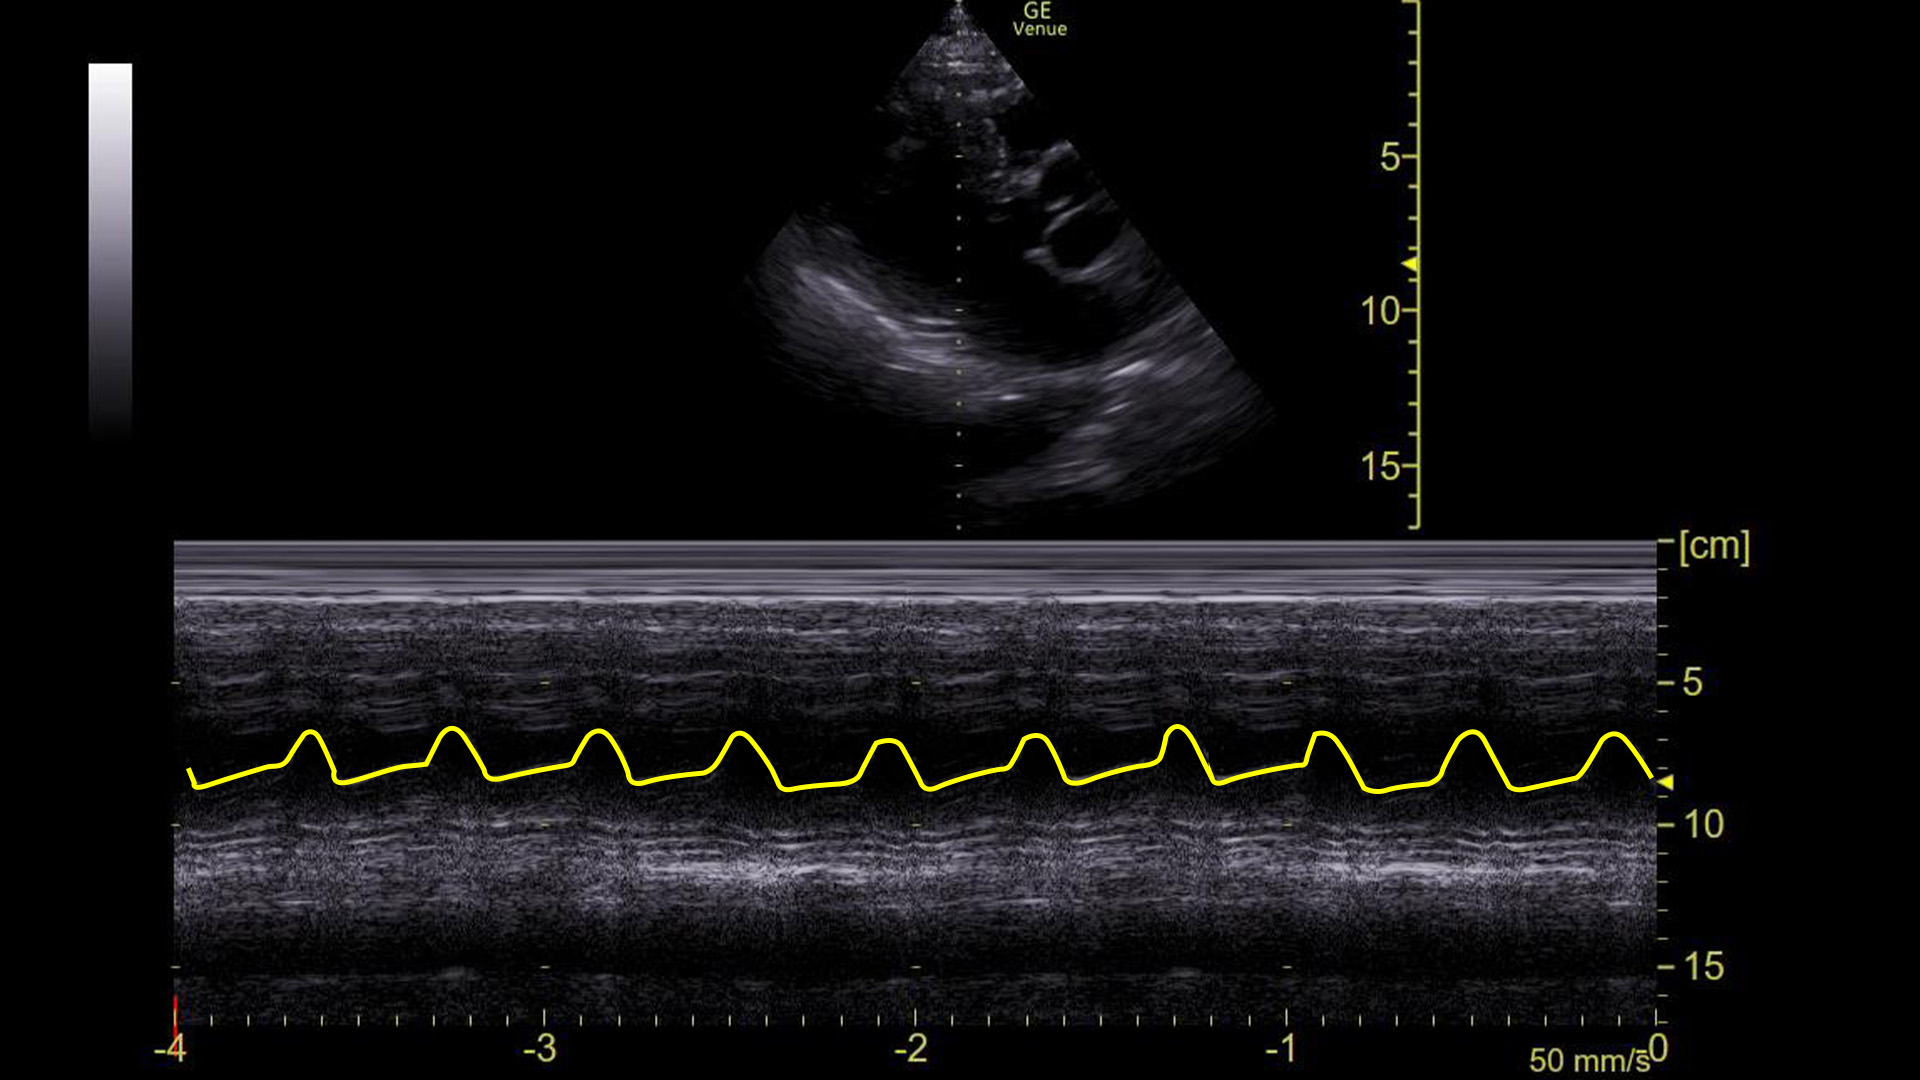
What we are looking at here is the movement of the mitral valve within the left ventricle – specifically what is highlighted in yellow is the movement of the anterior leaflet of the mitral valve. (Recall that it has two leaflets: anterior and posterior.)
You can see that the leaflet flaps once per cardiac contraction. That, however, is ABNORMAL!
Given the hypotension and the fact that he did not respond to fluids, we cardioverted him. Here is the same tracing after the cardioversion:
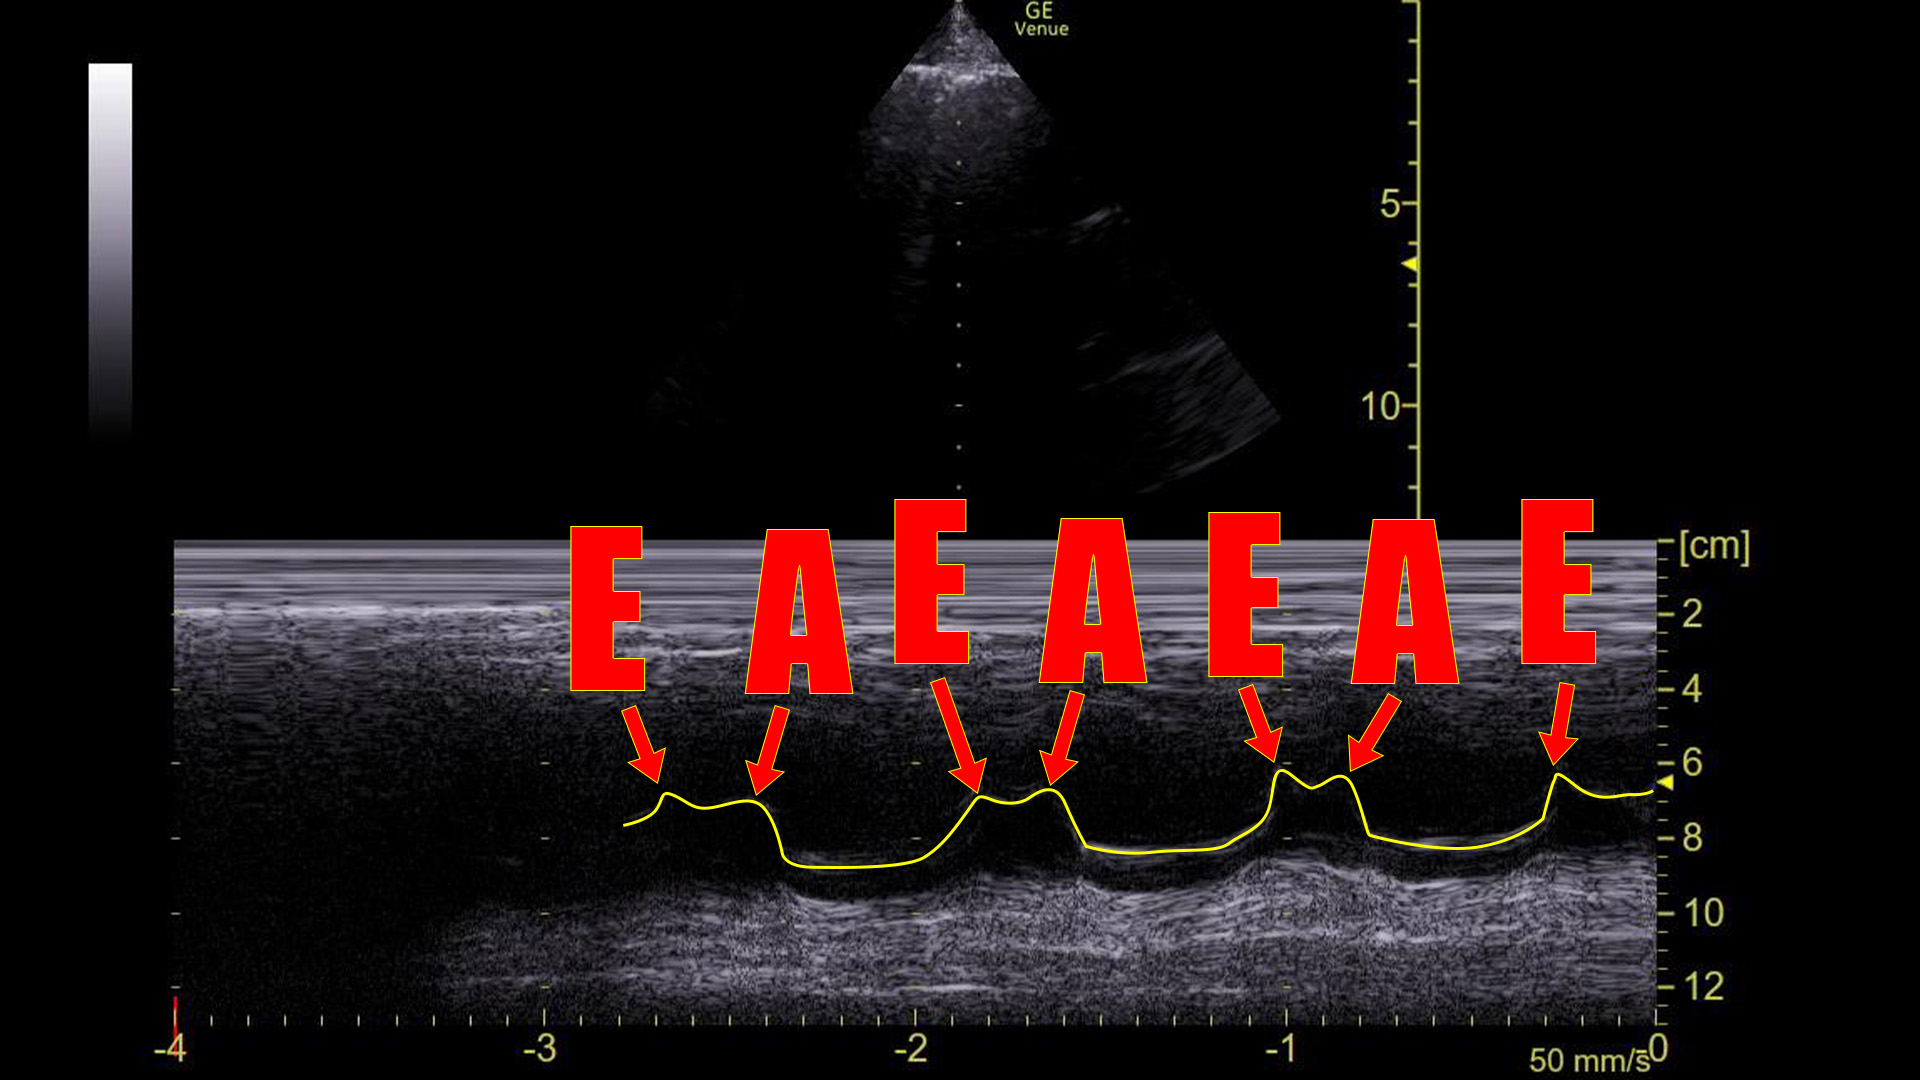
Adding the same highlight as above:
Here we see there are two flaps of the mitral valve with every beat of the heart, which is what we see in sinus rhythm. Indeed, the patient was in sinus after the cardioversion and his blood pressure normalized immediately.
To understand what we are seeing here, lets take a moment to recall how ventricular filling happens. We will start at the point that the left ventricle is full of blood and begins to contract.
- The pressure in the left ventricle (LV) goes up because the contracting muscle makes the size of the chamber smaller around a fixed volume of blood.
- The mitral valve (which had been open and letting blood move from the left atrium into the left ventricle) is a one way valve. It closes in response to the increasing LV pressure preventing blood from flowing backwards.
- The aortic valve, also a one way valve, opens in response to the increasing pressure in the LV and blood flows out from the LV through the now open aortic valve down the pressure gradient.
- After ventricular contraction is complete, the myocardium of the LV relaxes and its size begins to increase back to its resting state.
- The pressure inside the LV falls during relaxation because its size is increasing around a now smaller volume of blood. (Exactly how much smaller the amount of blood left in the LV after contraction is defines the ejection fraction.)
- This negative pressure “pulls” blood in from the right atrium opening the mitral valve. This process is called passive ventricular filling.
- The aortic valve closes, which prevents back flow of blood from the aorta into the LV.
- As the LV fills with blood, its pressure eventually surpasses that in the left atrium. The mitral valve then closes preventing backwards flow.
- However, before it closes completely, the atria contract and the mitral valve is blown open a second time. This is the so called “atrial kick”.
- At that point, we are back to where we started.
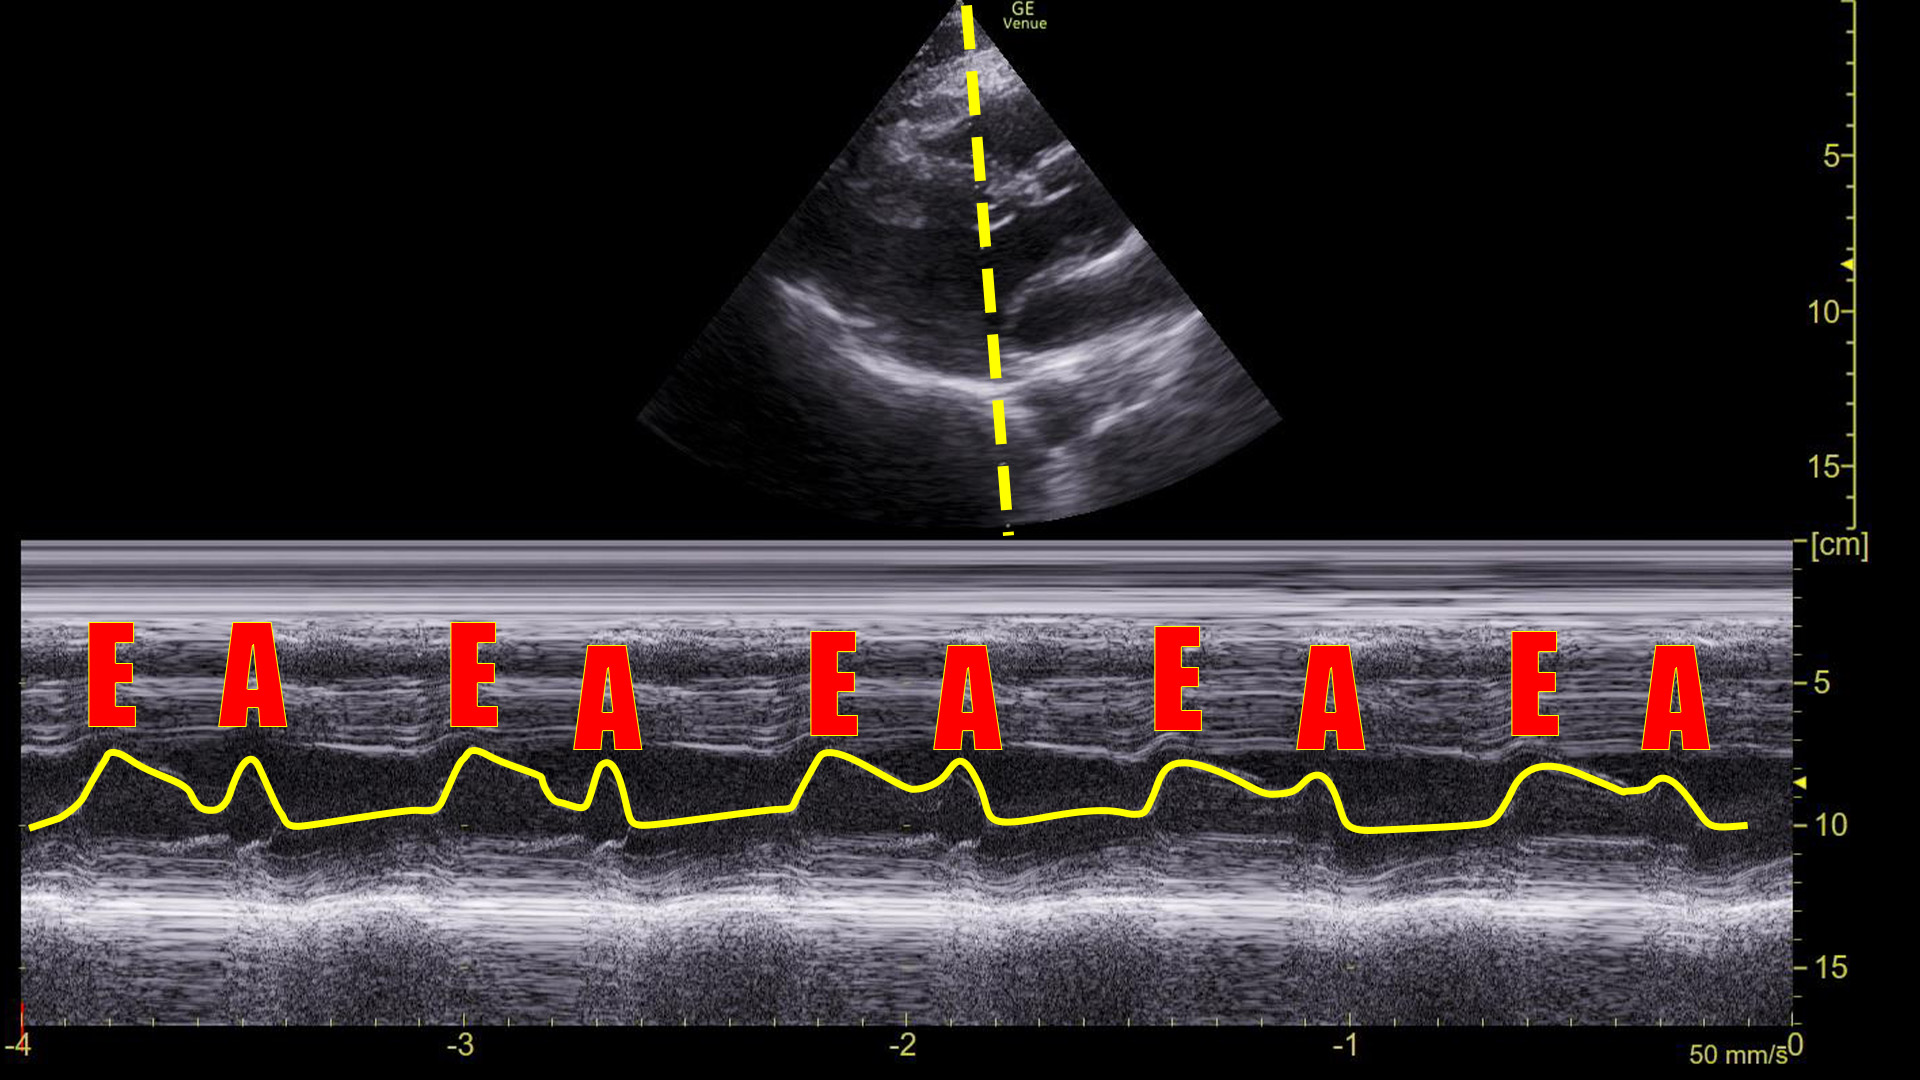
The point is, that in a sinus rhythm, the mitral valve opens not once, but twice for every contraction: Once during ventricular relaxation (passive ventricular filling) and a second time during atrial contraction.
We can see this on ultrasound as demonstrated above. Graphically on the screen, the first movement is called the E-wave, and the second is called the A-wave.
Compare that to the tracing before the cardioversion:
There are no A-waves.
This tells us that the atria are not contracting in an organized, functional way because the mitral valve is only flapping once during each heart beat.
This cannot be a sinus rhythm. However, it does not necessarily identify what the arrhythmia is. Atrial fibrillation would certainly look like this, although it would probably not be this regular. Atrial flutter with 2:1 block would look like this**. “SVT” would look this way as well as would ventricular tachycardia. The point is that the absence of A-waves at the mitral valve rules out normal atrial contractions, but does not, by itself, define a particular arrhythmia.
In this case, since the rate never moved off of 150(ish) and the QRS complex was narrow, I think it was safe to say this was atrial flutter with a 2:1 block. Luckily, all of the arrhythmias in question respond favorably to electricity.
**Keep in mind that we are looking at the mitral valve movement, not the atria themselves. Flutter movement can be seen on ultrasound if you look at the atria. Also, if the patient were conducting at a rate less than 2:1, you might see some movement of the mitral valve from flutter waves. It might even cause some flow that was measurable with Doppler imaging (1,2). As always, there are experts in this field that would consider this a kindergarten level discussion of this topic. So be it. We are using this tool very bluntly.***
Let’s step back and look at how to get an M-mode tracing like we have been looking at.
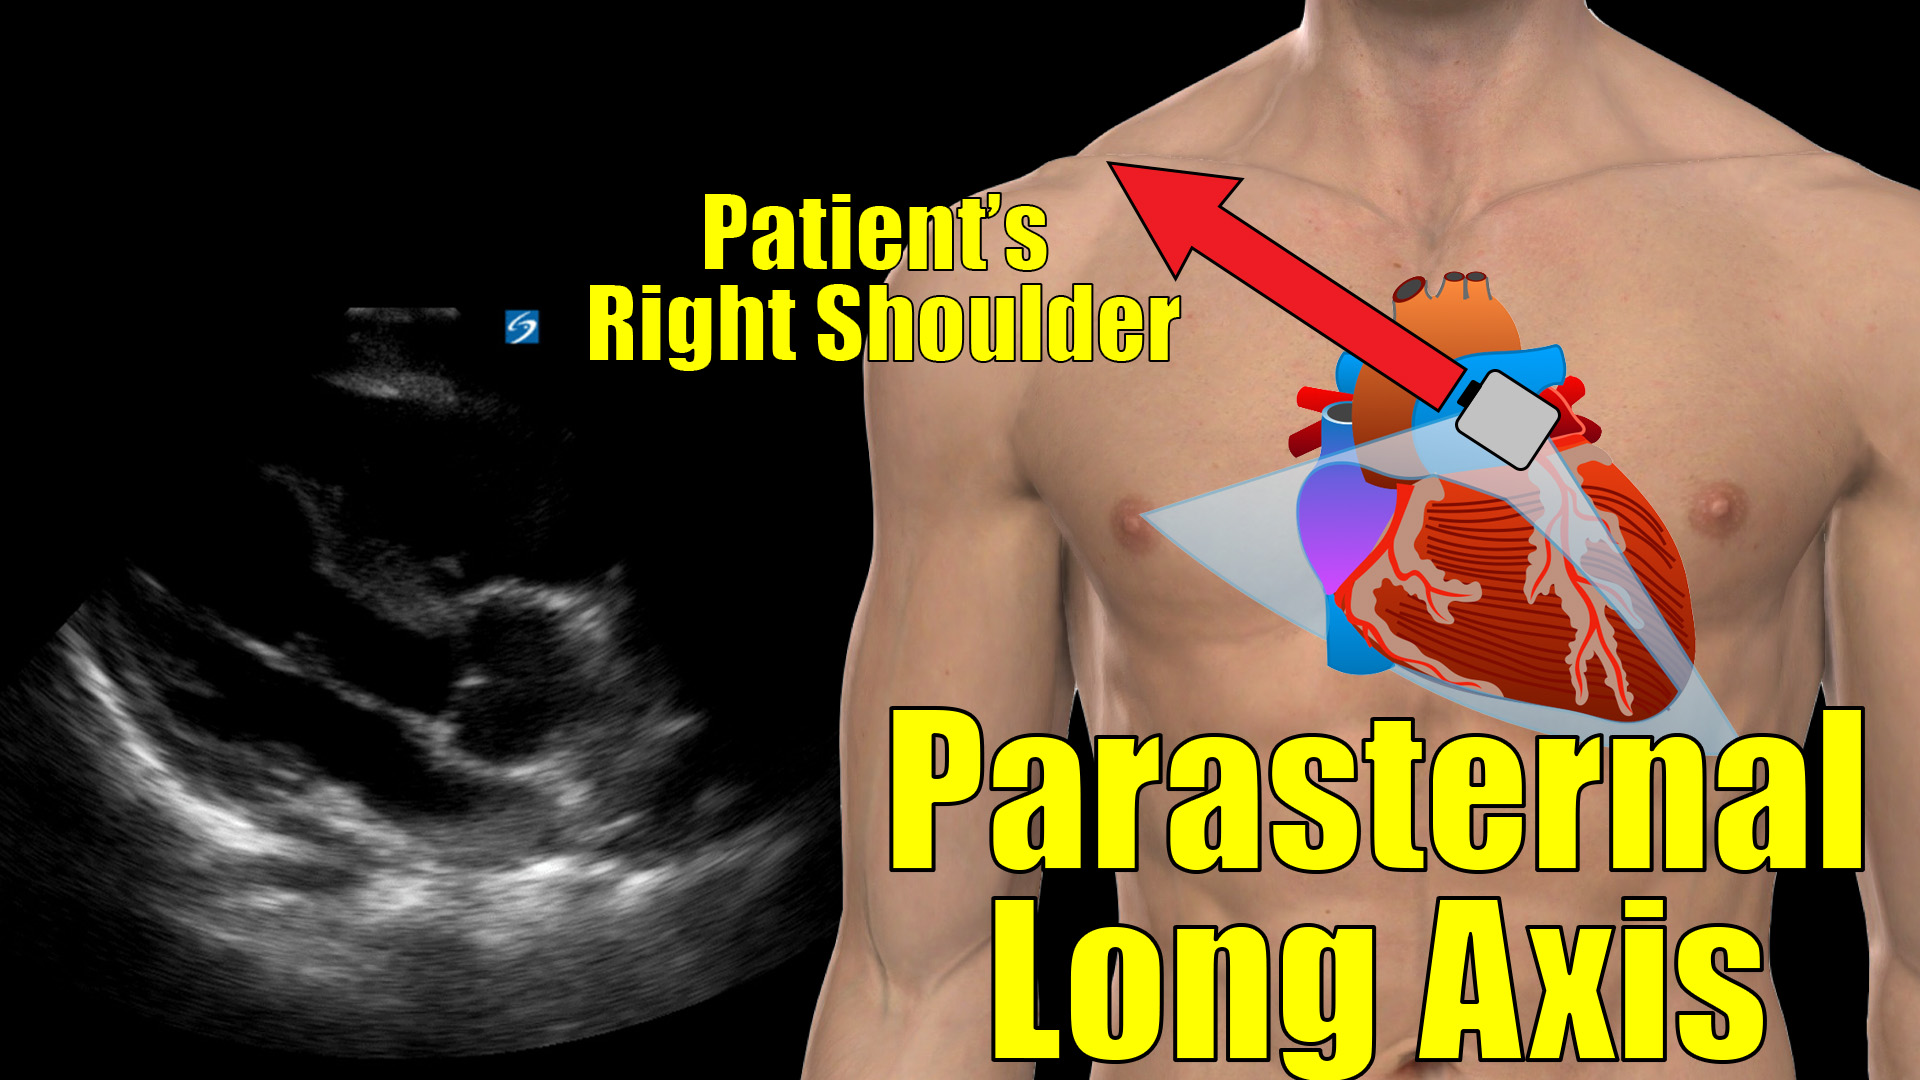
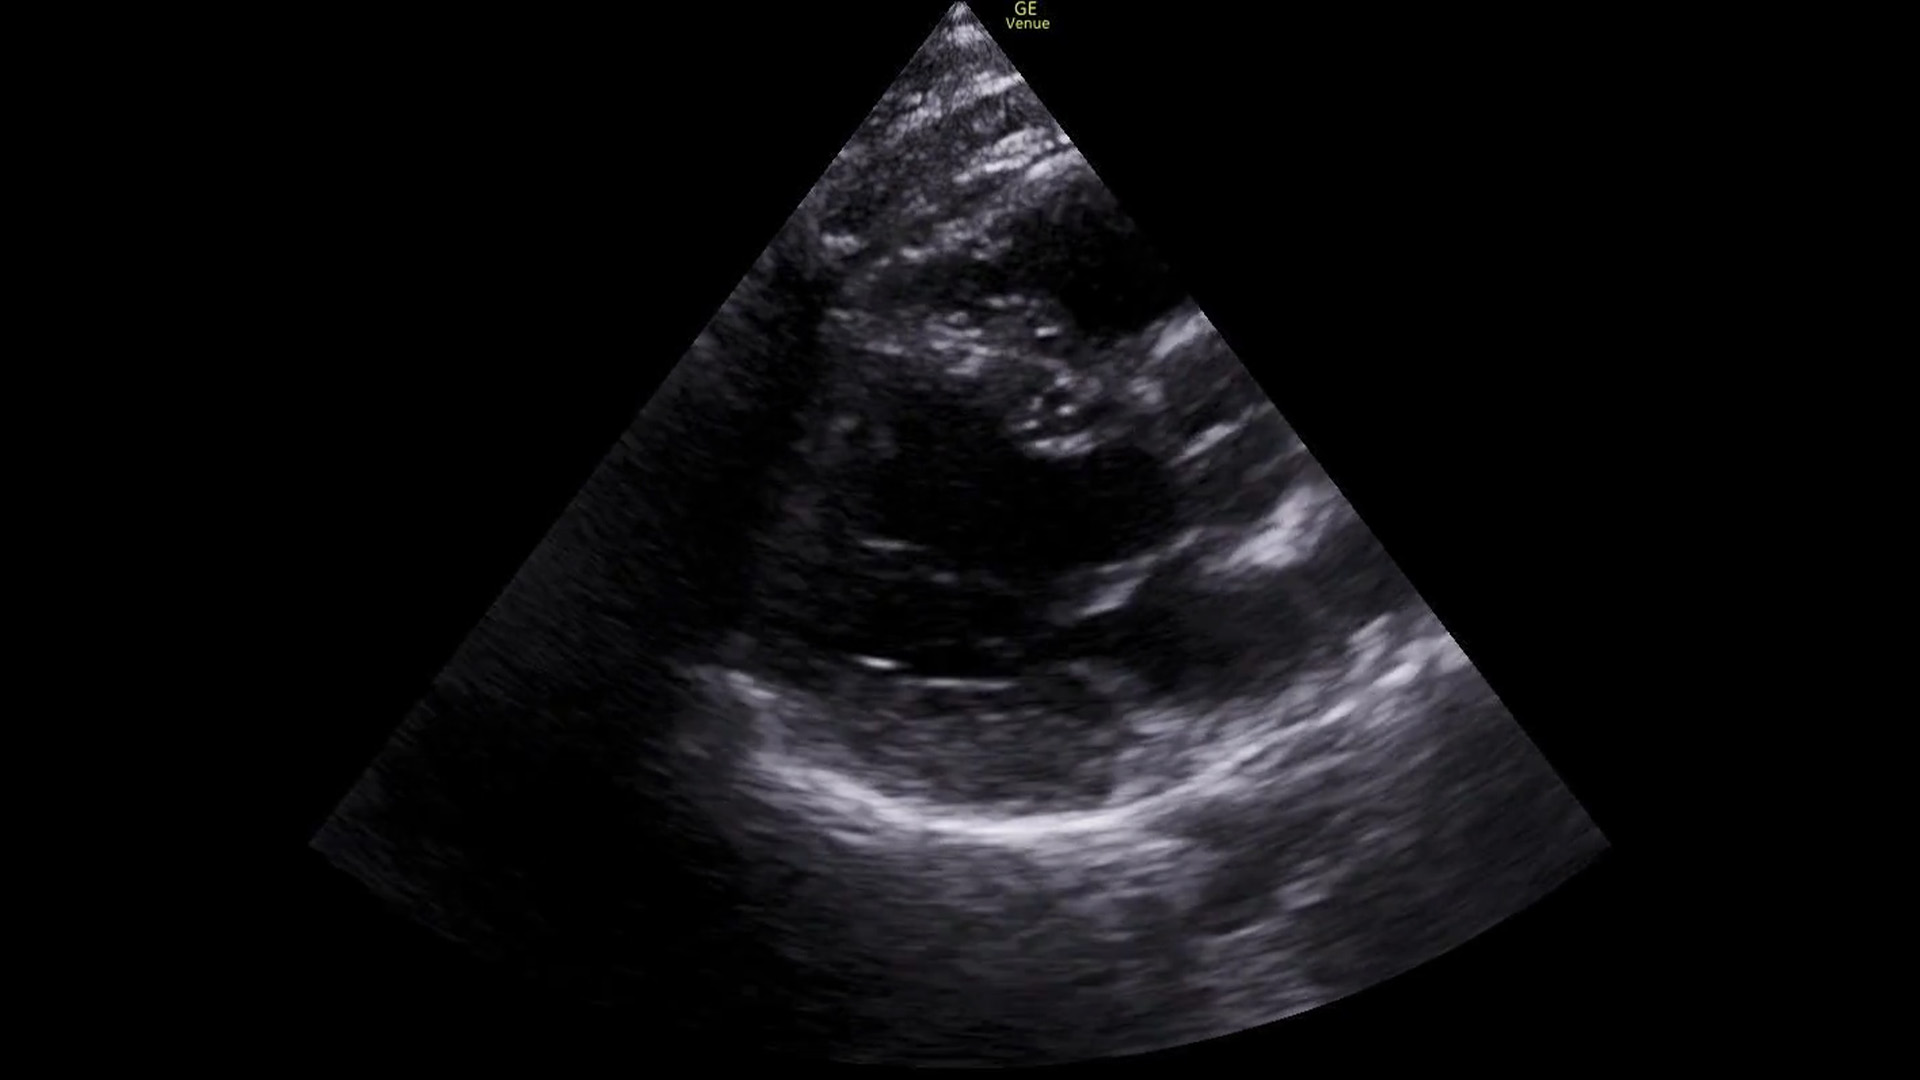
First we get a parasternal long axis view:
We must be able to identify the structures in the image:

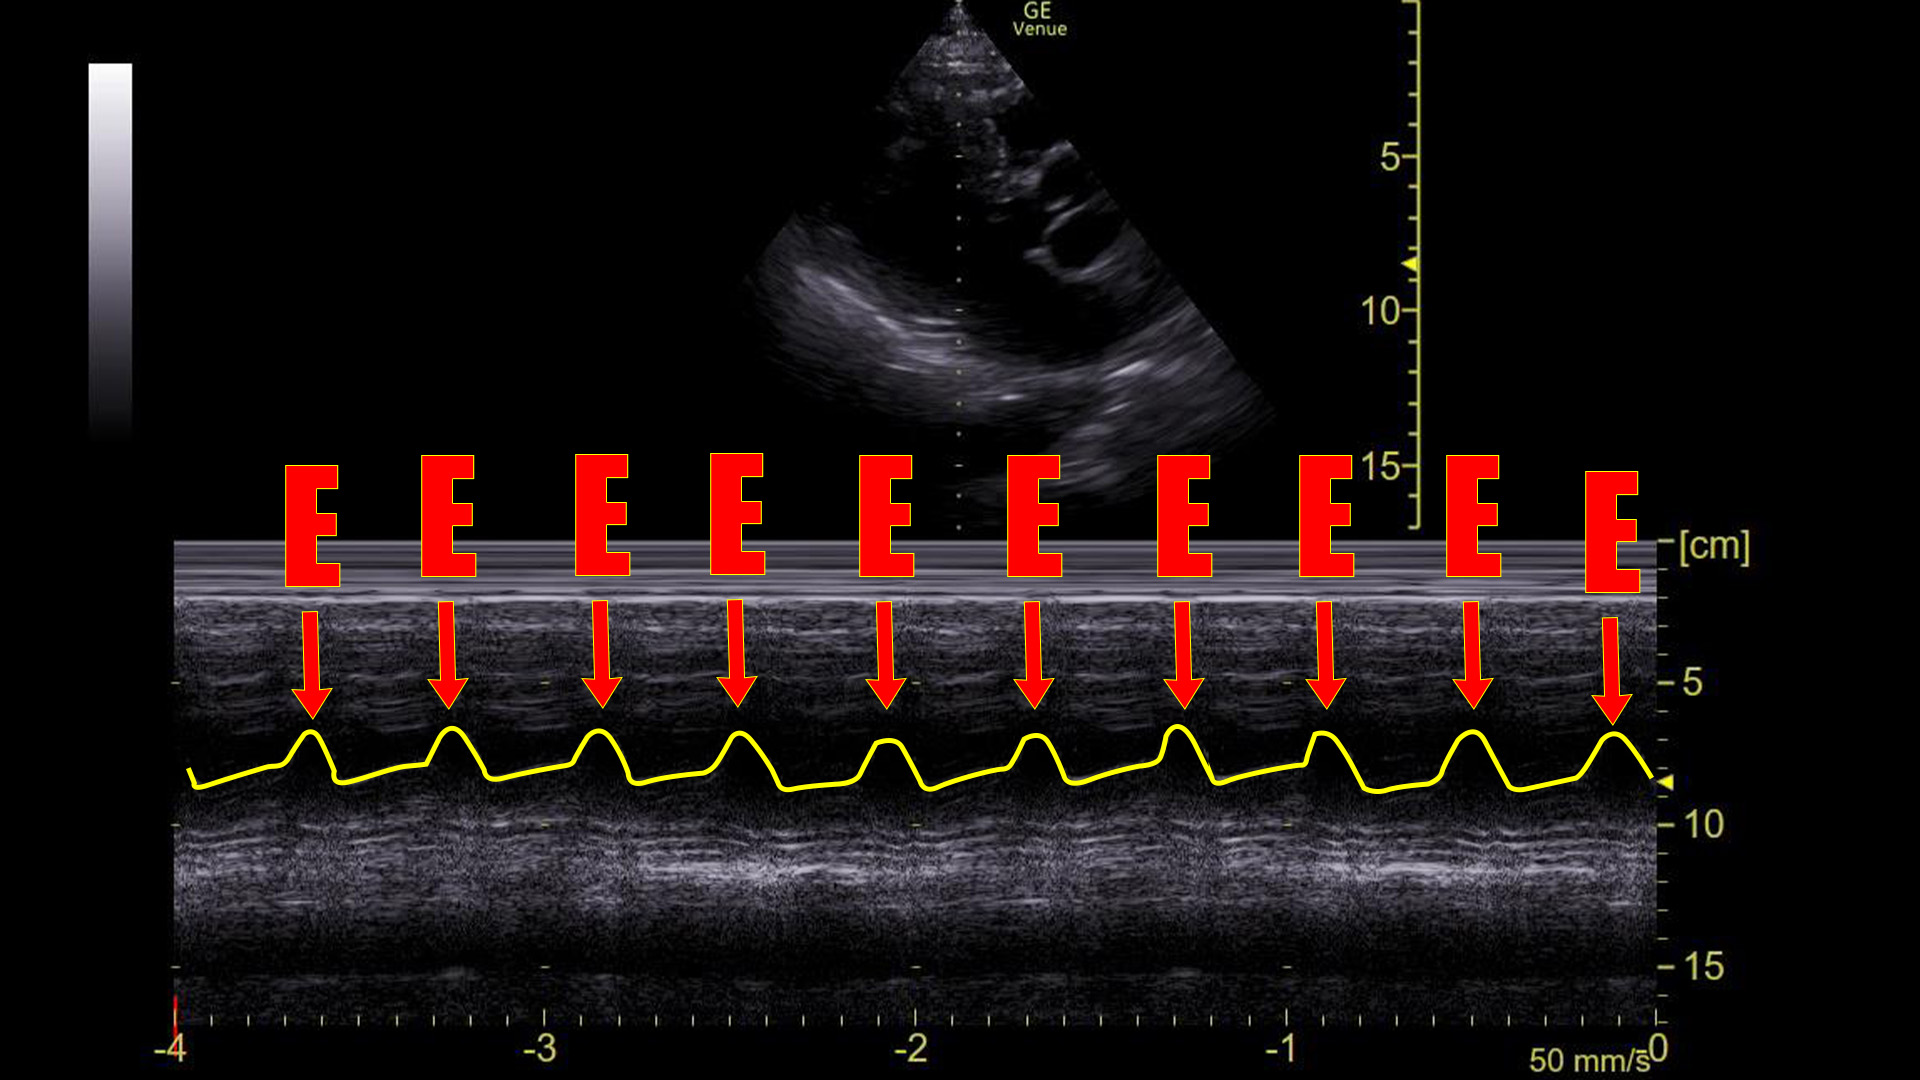
Turn on M-mode and put the spike through the tips of the mitral valve
In a sinus rhythm, we see E-waves and A-waves. This is a normal appearing tracing.
Summary
There are so many learning points in this case.
Mitral valve movements
In a sinus rhythm, the mitral valve opens twice during ventricle filling: once during passive filling, then again during atrial contraction. We can see these two movements on an M-mode tracing with the spike placed through the anterior leaflet of the mitral valve on a parasternal long axis view of the heart. Graphically, the first movement produces a wave that is termed the E-wave; the second is the A-wave. Absence of the A-wave tells us that there is no atrial contraction, which would be seen in conditions like atrial fibrillation, SVT, atrial flutter, or ventricular rhythms.
Although it can be useful in this situation, I find that understanding E-waves and mitral valve physiology is more tangibly helpful in day-to-day use for estimating ejection fractions – a topic for another post.
M-mode
M-mode is a way to represent movement on a still image. To use it, a line (often referred to as a “spike”) is placed on a two-dimensional “B-mode” image. A recording is then made of the piece of the image under that spike over time. If nothing moved during the recording, it would produce a uniform/still tracing. However, if there is movement under the spike, it is visible on the tracing.
In terms of point-of care ultrasound, this is a bit of leftover from times when we saved our ultrasounds as printouts on thermal paper. If your only option was to print a 2-dimensional image, M-mode was the only way that movement could be documented – lung sliding for example. These days we use digital image storage and saving a video clip is more common. There are still times when this is useful, however, as we have seen in this case. In particular, measurements can be made on M-mode tracings, which cannot be done on video clips. In point-of-care applications, there are only a few instances where we need M-mode to make measurements: most commonly is first trimester fetal heart rates, but there are others (TAPSE, EPSS, etc.) Comprehensive echocardiography on the other hand uses this modality liberally to get detailed and accurate measurements of various cardiac functions.
RUSH exam
Rapid Ultrasound for Shock and Hypotension (RUSH) is an ultrasound protocol (3) that uses several imaging techniques to help determine the type of shock a patient is suffering from. It is clearly not necessary in all cases as the type of shock can often be sorted out based on history and examination. There are times, however, when you get a curveball. This patient, for example, seemed to have straight forward distributive or hypovolemic shock, both of which should show a collapsible or flat IVC suggestive of volume depletion. He didn’t have that. His IVC was plump. This RUSH finding led us to the fact that we were barking up the wrong tree and helped steer us to the actual cause of his shock: his arrhythmia.
There are plenty of online sites for more discussion of the RUSH exam. Here are a few:
It’s fun when you get a chance to use the stuff you know, and in this case we got to use a lot of it.
Scan early, often, and happily, my friends.
References
- Jang WI, Park JH, Lee JH, Choi SW, Jeong JO, Seong IW. Cardiocascular images. M-mode echocardiographic demonstration of atrial flutter. Circ Cardiovasc Imaging. 2009 May;2(3):e20-1. doi: 10.1161/CIRCIMAGING.108.816470. PMID: 19808585.
- Zoneraich S, Zoneraich O, Rhee JJ. Echocardiographic findings in atrial flutter. Circulation. 1975 Sep;52(3):455-9. doi: 10.1161/01.cir.52.3.455. PMID: 1157244.
- Perera P, Mailhot T, Riley D, Mandavia D. The RUSH exam: Rapid Ultrasound in SHock in the evaluation of the critically lll. Emerg Med Clin North Am. 2010 Feb;28(1):29-56, vii. doi: 10.1016/j.emc.2009.09.010. PMID: 19945597.
