We had something come up twice over the past month or so with our ECGs. Several of the residents had trouble spotting the issue. I bet they were not the only ones. Can you see the problem?
Something looks strange, but I can’t put my finger on it
These first two ECGs were done on the same patient five minutes apart. The voltages on the first were noted be very low. What accounts for the change? Did we drain her pericardial effusion? Hmmm…

This is the other case with the same problem. Besides the rhythm disturbance, what’s unusual about this ECG?
So, what gives?
The thing to notice is the calibration setting. Standard calibration is that each small red line on the paper (they are 1 mm apart) equals 0.1 mV. So, 10 lines (two “big boxes”) is 1 mV.
Two of the three ECGs above are not in standard voltage calibration.
First, look again at the second ECG.

Notice that the calibration at the bottom does indicate that this study is in standard 10 mm/mV. Look at the calibration line. Notice that it is 10 small boxes high. Normal.
Now look again at the first example.
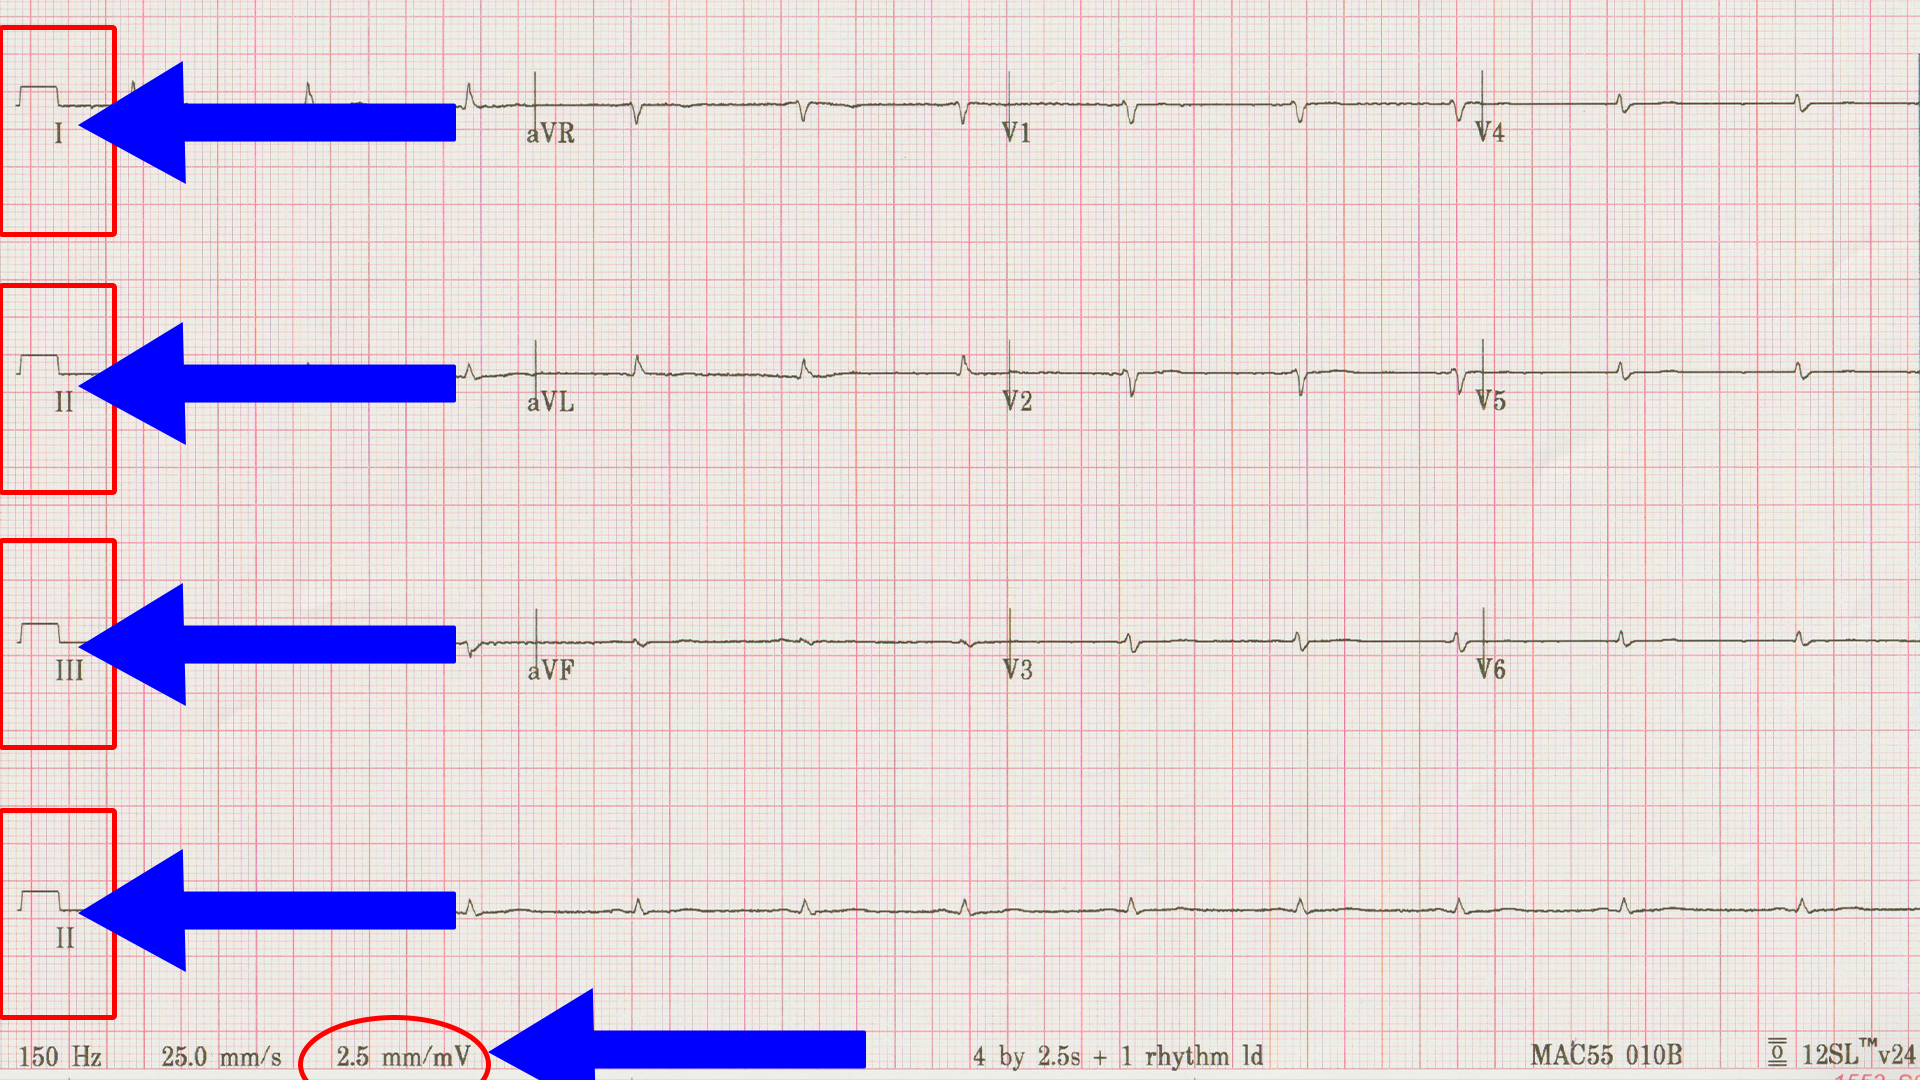
Notice that the calibration box is only 2.5 small boxes high and that the readout at the bottom says 2.5 mm/mV. That’s why the voltages “seem” so small. To get the second ECG above, we had the tech reset the calibration. That was the only change.
Just to hammer it home, have a look at the third example.
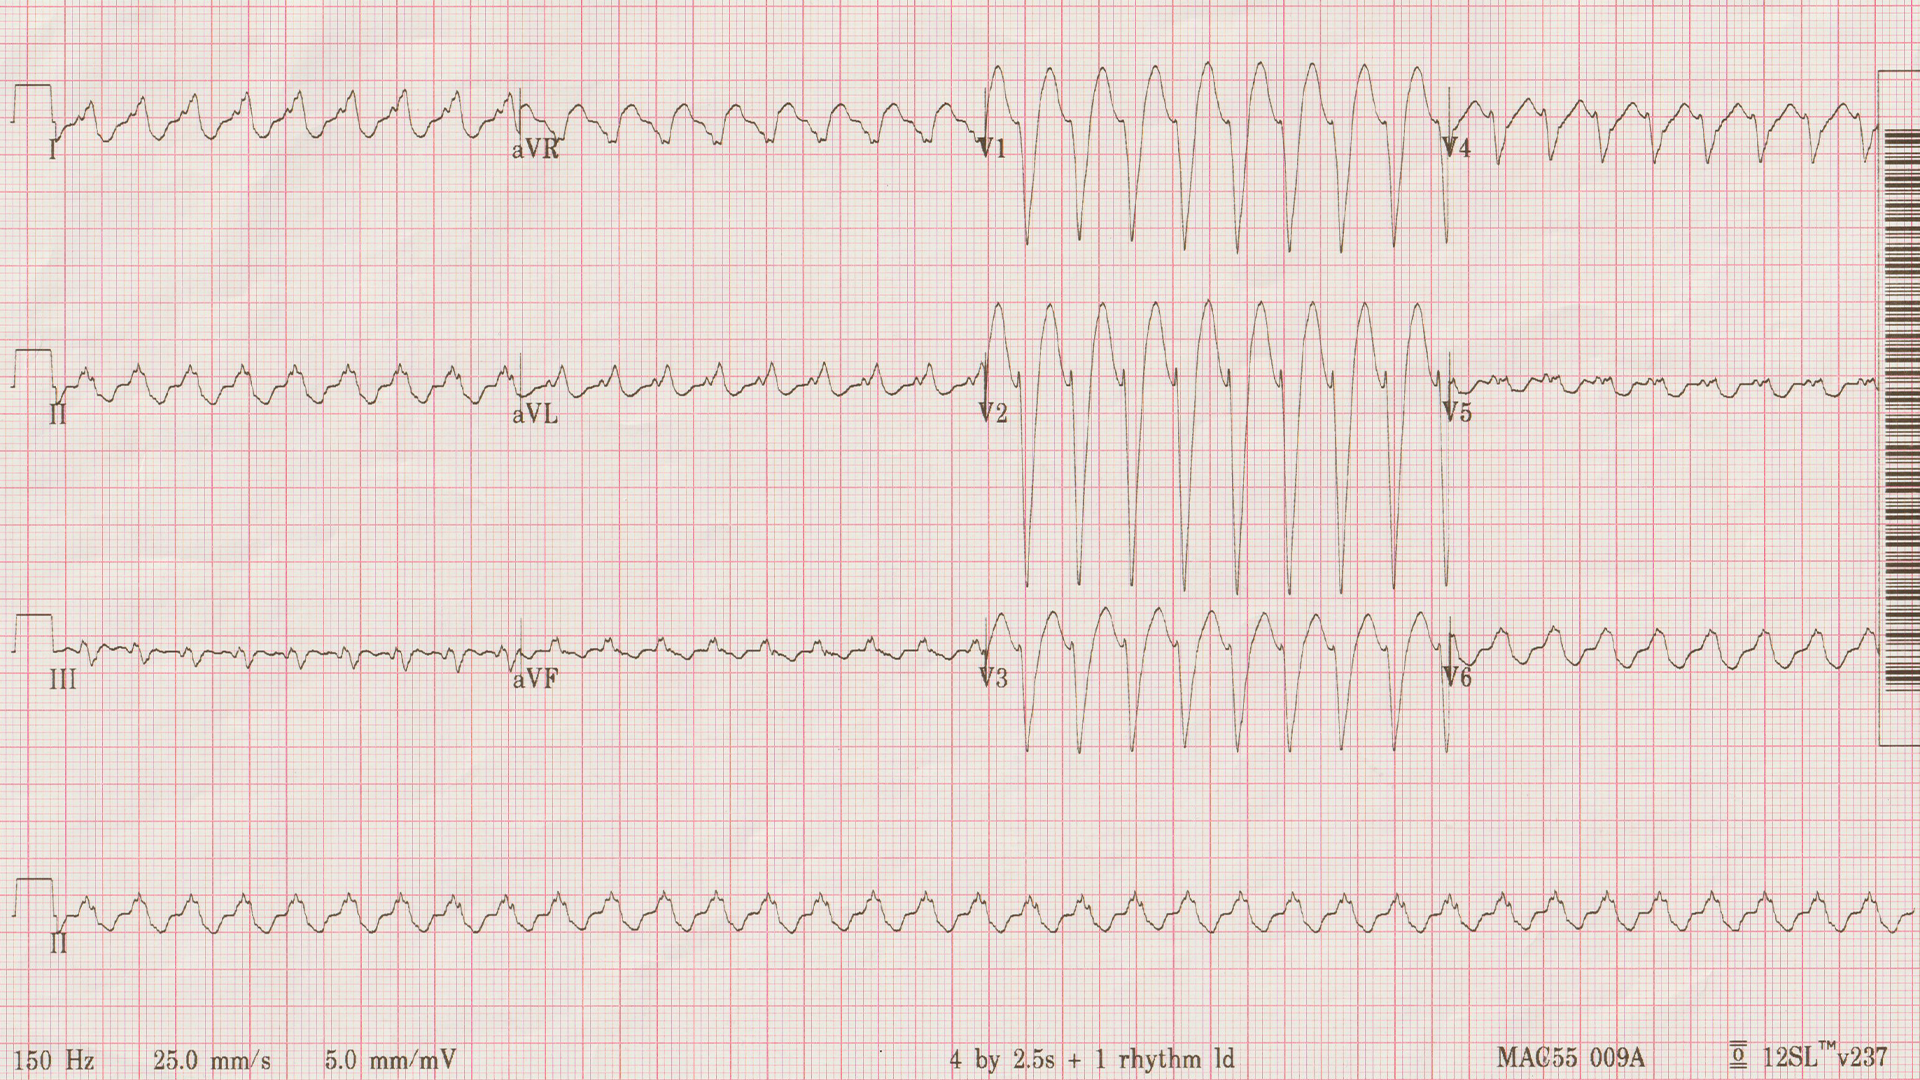

The calibration box is five small boxes tall, and the readout agrees that the machine is set to 5 mm/mV.
Is it actually helpful to know this?
Sort of. I don’t recall ever having actively changed the voltage calibration, but sometimes it does get changed as in the cases above. In the third example, the machine did it due to the large voltages in V1-V3. It does make those fit on the page better, although is makes the other leads a little more difficult to interpret. In the first case, however, I think it was accidentally changed by a person. Recognizing it and getting is straightened out kept us from having to go down the “low voltage rabbit hole” unnecessarily.
On a related note, I have changed the paper speed away from the standard 25 mm/s. Speeding up the paper makes the p waves easier to find in cases of tachycardia. I have done that when sorting out sinus tachycardia from SVT was a problem.
When should we look at the calibration?
It only takes a fraction of a second to glance at this on every ECG. It’s probably something you should get in the habit of doing every time.
Even if you don’t do it “every time”, this should be part of your troubleshoot algorithm of an odd looking ECG. The other being checking for limb lead misplacement by whatever means you are familiar with – I look at aVR and V1. They should be in the same direction – both down-going, with very few exceptions. If they aren’t – think limb lead misplacement.
Understanding this sort of thing is what moves you from a pattern recognizer to someone who truly understands how the ECG works. It’s the difference between being able to order a taco at a Mexican restaurant versus being able to speak fluent Spanish.
Let’s wrap it up
Standard voltage calibration on ECG is 10 mm/mV. This is shown both graphically and written out numerically on every ECG that you have ever seen whether you realize it or not. When the machine changes it, it is usually a good thing. However, recognizing when it’s abnormal can save you some grief when if it gets done in the wrong setting. Remember, measurements like LVH criteria assume standard calibration and don’t apply to other situations.
