Some research papers report their results as Risk Ratios. Others report Odds Ratios. What’s the difference and why would someone pick one or the other to report? Read on.
What is risk?
In terms of statistics, risk is the number of times an outcome did happen compared to the number of times it could have happened. If 8 people were exposed to a germ and 3 people got sick, the risk of getting sick after an exposure would be 3 out of 8.
What are odds?
Odds, on the other hand, is the ratio of the number of times something did happen to the number of times it did not happen. In the above example, the odds of getting the disease would be 3 to 5.
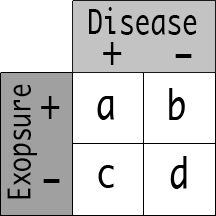
Odds of having the outcome in the exposed = a/b
Odds of having the outcome in the unexposed = c/d
Risk of having the outcome in the exposed = a/(a+b)
Risk of having the outcome in the unexposed = c/(c+d)
What is a Risk Ratio or Odds Ratio?
These terms are the comparison of the risk (or odds) in the exposed cases compared to (or divided by) the cases in the unexposed. Risk Ratios and Odds Ratios are commonly used “point estimates” in scientific research – a single number that represents the findings in the study.


When would odds ratios be used instead of risk ratios?
Risk is more intuitive. We commonly think in terms of risk: batting averages and test grades, for example. Risk is used for prospective studies. Odds are generally used for retrospectively collected data, i.e. case-control studies. The reason is a little complex, but the summary is that risk calculations depend on the data representing the true prevalence of disease while odds do not.
In a prospective study, the researcher selects the number of subjects to include and ideally exposes half to a treatment and half to a sham treatment. So, the researcher chooses the entire study size and the prevalence of disease is built in to the sample.
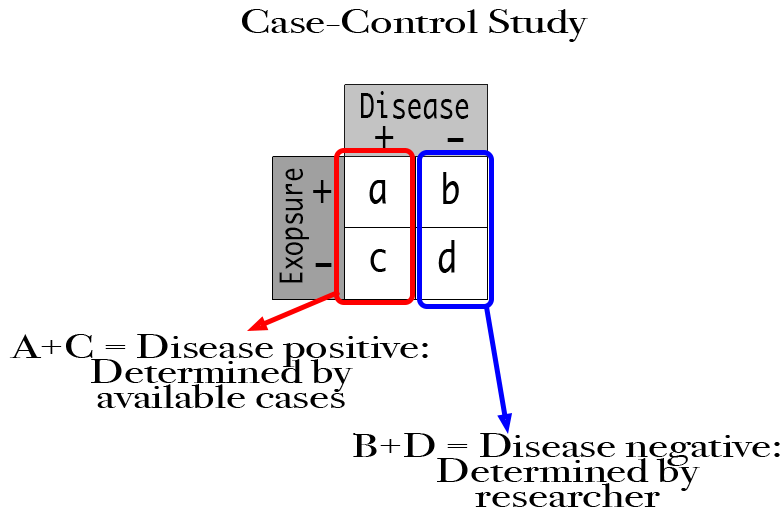
Some diseases, however, are so uncommon that they can’t be studied prospectively. Instead, the researcher waits for a case to occur then looks back for the presence or absence of the exposure of interest. These are the “cases” in a case-control study. Then, they select a group of subjects without the disease and look back for the presence or absence of the same exposure. These are the “controls” in the case-control study.
The number of patients in the disease positive arm is determined by how many cases the researcher can find. That number makes itself. The number of patients in the disease negative arm, however, is determined by the researcher. It could be equal to the number in the disease positive arm or any other number the researcher chooses. Since the researcher can arbitrarily affect one side of the 2 x 2 table, this data set will almost certainly not represent the true prevalence in the population.
This is where the difference between risk and odds come into play. The calculation used to determine risk [a/(a+b)] is affected by the size of the disease negative arm, but that for odds is not. So, a researcher could manipulate the risk ratio in a case-control study by altering the number of controls. This would not affect the odds ratio, however. An example will make it more clear.
Let’s say researchers have found a new disease: gastrothrombosis. They have found 40 cases. Looking through the records, they see that 36 of 40 cases had swam in the White River recently. They then found 40 controls that did not have gastrothrombosis and found that 2 of those people had swam in the White River recently.
Let’s see the effect that changing the control size has on the Odds Ratio
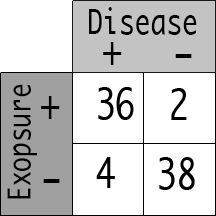
40 Disease +
40 Disease –
The Odds Ratio calculation for this data set is:
(36/2) / (4/38)
The Odds ratio = 171
Let’s say the researcher decided to use 80 cases in the control group (those 80 should still have 2:38 prevalence, so they would break down as 4:76). Would the Odds ratio be affected?
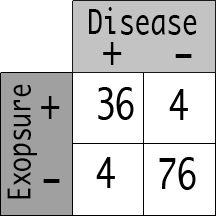
40 Disease +
80 Disease –
The Odds Ratio calculation would now be:
(36/4) / (4/76)
The Odds Ratio = 171.
If the researcher used 160 controls, they would shake out as 8 river swimmers and 152 non river swimmers.
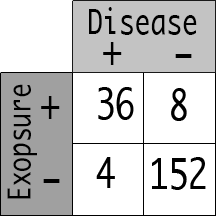
40 Disease +
160 Disease –
The Odds Ratio calculation would now be:
(36/8) / (4/152)
Do the math, the Odds Ratio still = 171.
Now let’s see if changing the size of the control arm affects the Risk Ratio
For the first set of numbers, the risk in the exposed would be 36/38 and the risk in the unexposed would be 4/42.
40 Disease +
40 Disease –
The Risk Ratio calculation would be:
(36/38) / (4/42)
The Risk Ratio = 9.95
In the second set of data (researches using 80 controls):
40 Disease +
80 Disease –
The Risk Ratio calculation would be:
(36/40) / (4/80)
The Risk Ratio now = 18
In the third data set (160 controls)
40 Disease +
160 Disease –
The Risk Ratio calculation would now be:
(36/44) / (4/156)
The Risk Ratio now = 31.91
As you can see, adding controls to the data set of a case-control study would change the risk ratio but would not affect the odds ratio. That’s why we use odds in retrospective studies even though it is a little less familiar than risk.
